
RANGE RESOURCES CORP (NYSE:RRC) was identified as a Technical Breakout Setup Pattern by our stockscreener. Such a pattern occurs when we see a pause in a strong uptrend: after a strong rise the stock is consolidating a bit and at some point the trend may be continued. Whether this actually happens can not be predicted of course, but it may be a good idea to keep and eye on NYSE:RRC.
Insights from Technical Analysis
As part of its analysis, ChartMill provides a comprehensive Technical Rating for each stock. This rating, ranging from 0 to 10, is updated on a daily basis and is based on the evaluation of various technical indicators and properties.
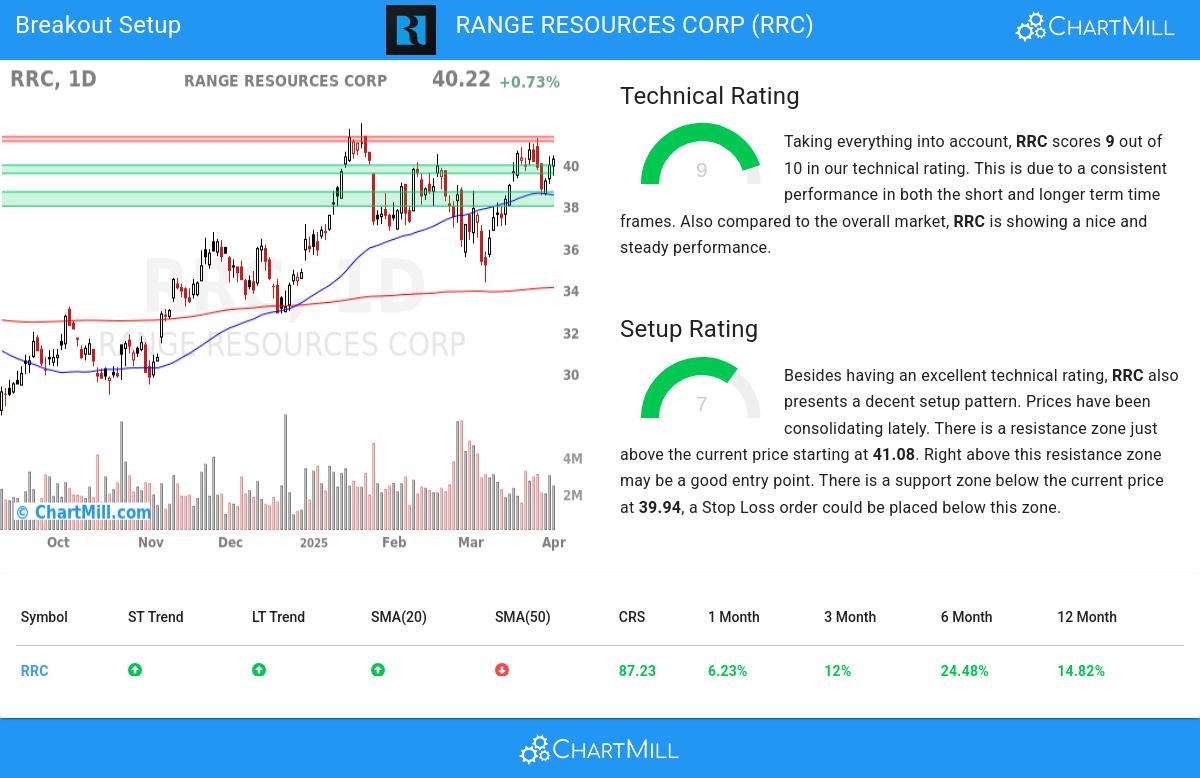
Taking everything into account, RRC scores 9 out of 10 in our technical rating. Both in the recent history as in the last year, RRC has proven to be a steady performer, scoring decent points in every aspect analyzed.
- Both the short term and long term trends are positive. This is a very positive sign.
- When comparing the yearly performance of all stocks, we notice that RRC is one of the better performing stocks in the market, outperforming 87% of all stocks.
- RRC is one of the better performing stocks in the Oil, Gas & Consumable Fuels industry, it outperforms 82% of 211 stocks in the same industry.
- RRC is currently trading in the upper part of its 52 week range. The market is still in the middle of its 52 week range, so RRC slightly outperforms the market at the moment.
- In the last month RRC has a been trading in the 34.32 - 41.25 range, which is quite wide. It is currently trading near the high of this range.
Check the latest full technical report of RRC for a complete technical analysis.
Why is RRC a setup?
Next to the Technical Rating, the Setup Rating of a stock determines to which extend the stock is consolidating. This score also ranges from 0 to 10 and is updated daily. The setup score evaluates various short term technical indicators. For RRC this score is currently 7:
RRC has an excellent technical rating and also presents a decent setup pattern. Prices have been consolidating lately. There is a resistance zone just above the current price starting at 41.08. Right above this resistance zone may be a good entry point. There is a support zone below the current price at 39.94, a Stop Loss order could be placed below this zone.
Trading setups like RRC
One strategy to consider is waiting for the actual breakout to occur, where the stock breaks out above the current consolidation zone. Traders can then enter a buy position, anticipating further upward momentum. As a risk management measure, it is advisable to set a stop loss order below the consolidation zone.
This article should in no way be interpreted as trading advice. You should always make your own analysis and trade or not trade based on your own observations and style. The article is based purely on some technical observations.
Every day, new breakout setups can be found on ChartMill in our Breakout screener.
Keep in mind
This article should in no way be interpreted as advice. The article is based on the observed metrics at the time of writing, but you should always make your own analysis and trade or invest at your own responsibility.