
Technical breakout strategies focus on finding stocks with solid momentum that are pausing before their next upward move. By using a high ChartMill Technical Rating (which measures trend strength) along with a high Setup Quality Rating (which spots consolidation patterns), traders can identify stocks ready for potential breakouts with clear risk levels. This method avoids overextended stocks and highlights those with strong technicals and good entry points.
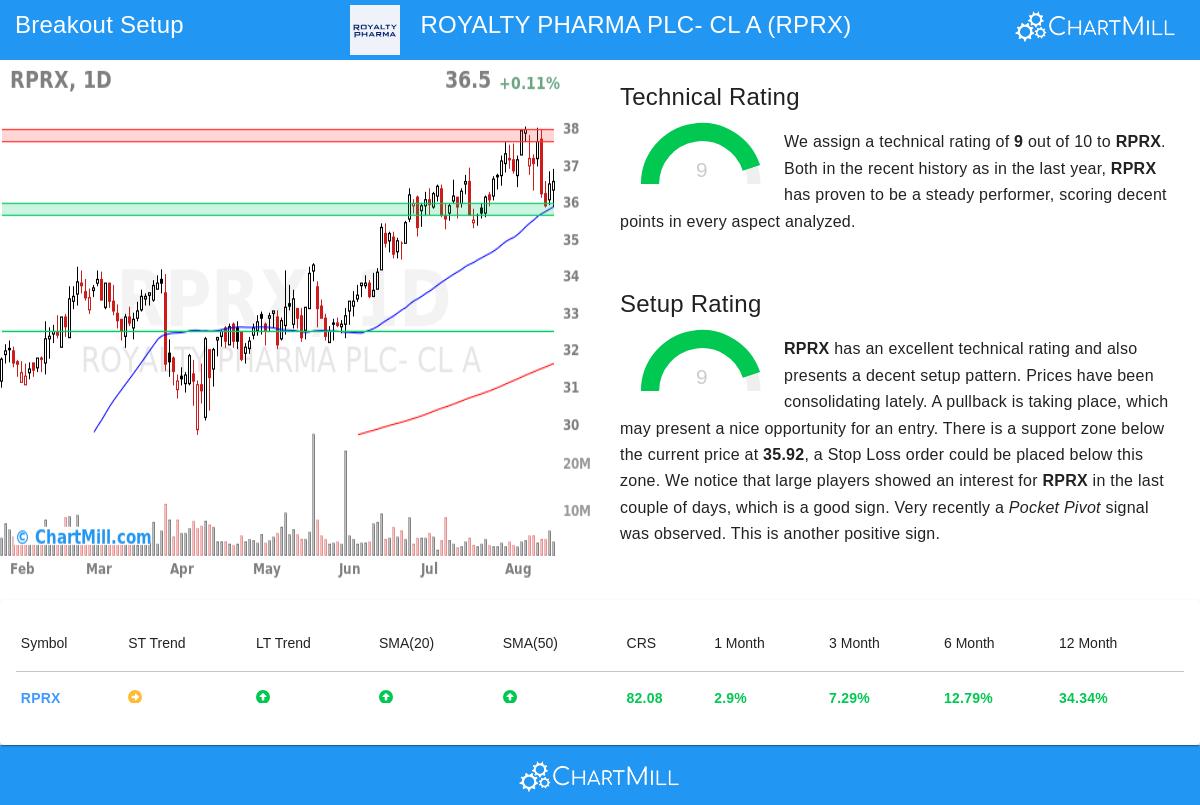
Royalty Pharma PLC - Class A (NASDAQ:RPRX) fits this strategy well, scoring 9 out of 10 on both technical and setup metrics, as noted in ChartMill's technical report. Here’s why the stock stands out for technical investors:
Technical Strength Highlights
- Trend consistency: RPRX shows a positive long-term trend with short-term neutrality, indicating a possible continuation after the pause. The stock is above all key moving averages (20-day at $36.72, 50-day at $35.84, 200-day at $31.59), and each average is rising.
- Relative outperformance: Over the past year, RPRX has gained 34.3%, placing it in the top 18% of all stocks. While it trades in the upper half of its 52-week range ($24.05-$38.00), it hasn’t matched the S&P 500’s recent highs, leaving room for growth.
- Volume profile: With an average daily volume of 3.56 million shares, liquidity is strong, reducing slippage risks for trades.
Setup Quality Advantages
- Consolidation pattern: The stock has moved between $35.31 and $38.00 over the past month, with recent price action tightening near the middle of this range. This often signals an upcoming move.
- Support structure: Three support levels exist below the current price ($35.60-$35.92, $32.46, and $31.10-$31.26), offering clear stop-loss areas. The nearest support at $35.92 aligns with the 20-day moving average, adding to its importance.
- Accumulation signals: Recent pocket pivot activity and institutional buying (per Effective Volume analysis) suggest smart money is involved during the pause.
Trade Setup Considerations
The technical report suggests:
- Entry trigger: $36.97 (above the 10-day MA)
- Stop-loss: $35.79 (below recent swing low)
- Risk parameters: 3.2% position risk, with 25% portfolio allocation recommended for 0.8% total portfolio risk
Aggressive traders may prefer the tight stop (1.28x ATR), while others could use the $35.60-$35.92 support zone for wider stops. Resistance near $37.59-$37.92 may lead to profit-taking on initial tests.
For investors looking for similar breakout opportunities, the Technical Breakout Setups screen updates daily with new candidates meeting these criteria.
Disclaimer: This analysis is for informational purposes only and should not be considered investment advice. Always conduct your own research and assess risk tolerance before trading.