
Technical investors often look for stocks that are in a solid uptrend and also moving in a limited area, preparing for a possible next upward move. One methodical way to find these chances is by using the ChartMill Technical Rating and Setup Quality Rating. The Technical Rating, a number from 0 to 10, measures the general condition and trend force of a stock. A high number points to a solid, maintained uptrend. The separate Setup Quality Rating, also from 0 to 10, judges the condition of a stock's present price pattern. A high number here means the stock is moving in a small area, giving a defined zone of stability and a possible lower-risk chance to enter on a price move higher. Using these two measures together lets traders sort for stocks with good technicals that are also showing clear setup forms.
A recent search using this approach has shown Rollins Inc. (NYSE:ROL) as a notable example. The international pest and termite control services company is now showing the exact mix of technical force and setup condition that technical breakout methods try to find.
Technical Force: A High-Level Example
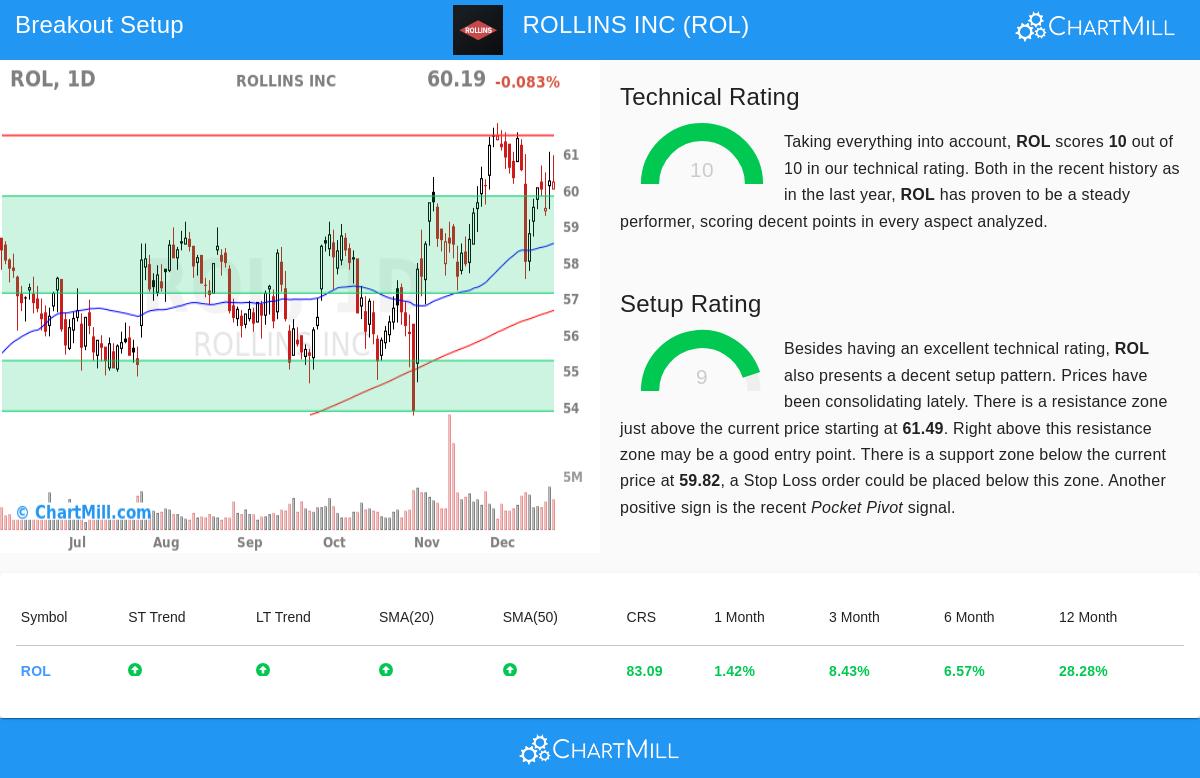
The base of any breakout trade is a stock with existing forward motion, and Rollins does very well here. According to its detailed technical report, ROL gets a full Technical Rating of 10 out of 10. This high number comes from several joining positive elements that verify a strong and steady uptrend.
- Trend Agreement: Both the long-period and short-period trends for ROL are scored as positive. This agreement across different time views is a clear mark of a sound, trending stock.
- Relative Performance: The stock is doing better than a large part of the market. It is in the top 17% of all stocks over the last year and does better than 83% of similar companies in the Commercial Services & Supplies industry. This shows interest from large investors and a leading place in its field.
- Price Level: ROL is trading close to its 52-week high of $61.84, a common trait of stocks leading the market. The report states this performance matches the wider S&P 500, which is also near highs, meaning the force is part of a larger market upward move, not a single event.
- Moving Average Stability: The stock's price is above all its important simple moving averages (20, 50, 100, and 200-day), and each of these averages is itself in a rising pattern. This forms a layered stability structure below the price.
This outstanding technical rating answers the important question of which stock to review. It marks ROL as a market leader with a good chance of continuing its set upward path, if a suitable entry point can be located.
Setup Condition: A Pause Before the Move
A forceful trend by itself is not a sign to buy; entering after a fast rise holds notable risk. This is where the Setup Quality Rating is key, answering the question of when to buy. Rollins gets a 9 out of 10 on this measure, meaning a very good pattern.
- Limited Trading Area: Over the last month, ROL has moved between $57.53 and $61.84. The report states that the stock is now trading in the center of this area, where prices have been pausing. This time of rest after a rise lets the stock reduce overbought levels and form a new base.
- Defined Stability and Barrier: The setup review finds a clear stability zone between $57.13 and $59.82, made from a mix of trend lines and moving averages. Just above the present price sits a barrier zone between $61.49 and $61.51. This creates a clear area: a move above the barrier could signal the next upward step, while the stability zone gives a reasonable place for a protective stop-loss order.
- Positive Volume Sign: Adding more support to the setup is a recent "Pocket Pivot" sign, a form that points to accumulation—buying by bigger participants—during the pause phase on higher-than-normal volume.
The high setup number confirms that ROL is not overstretched; it is waiting in a controlled way. This pause gives a possible lower-risk entry method: a buy order set just above the defined barrier, with a stop-loss set just below the important stability zone.
A Clear Technical Plan
The mix of these ratings leads to a specific, rule-based trading idea. The technical report proposes a possible breakout plan with an entry at $61.52 (just above the $61.49-$61.51 barrier zone). The suggested exit, or stop-loss, would be at $57.52 (below the stability zone and the recent area low). This sets a risk of about $3.99 per share, or 6.5% from the entry point. For a trader risking 1% of their total account funds on this idea, the trade size would equal about 15.4% of the account.
It is very important to know this is a sample case made from the technical details. The real choice to make such a trade needs personal checking, thought of wider market factors, and knowledge of company-specific news, like coming earnings reports.
Locating More Breakout Chances
The example of Rollins Inc. shows how mixing trend and timing measures can find clear ideas. For investors wanting to use this method each day, new technical breakout plans are found methodically and can be seen in the Technical Breakout Setups screener.
Disclaimer: This article is for information only and is not investment advice, a suggestion, or an offer or request to buy or sell any securities. The review shown is based on technical measures and should not be the only reason for any investment choice. All trading and investment choices include risk, including the risk of loss. Past results do not guarantee future results. Always do your own research and think about talking with a registered financial advisor before making any investment.