
Technical analysis investors often look for stocks showing both good momentum and consolidation patterns that indicate possible breakout chances. One methodical process uses filters for securities with high technical grades, which assess general trend condition, paired with good setup quality marks that spot times of price consolidation. This system helps traders find technically good stocks that are also creating possible entry spots, mixing trend condition with timing factors.
Technical Strength Evaluation
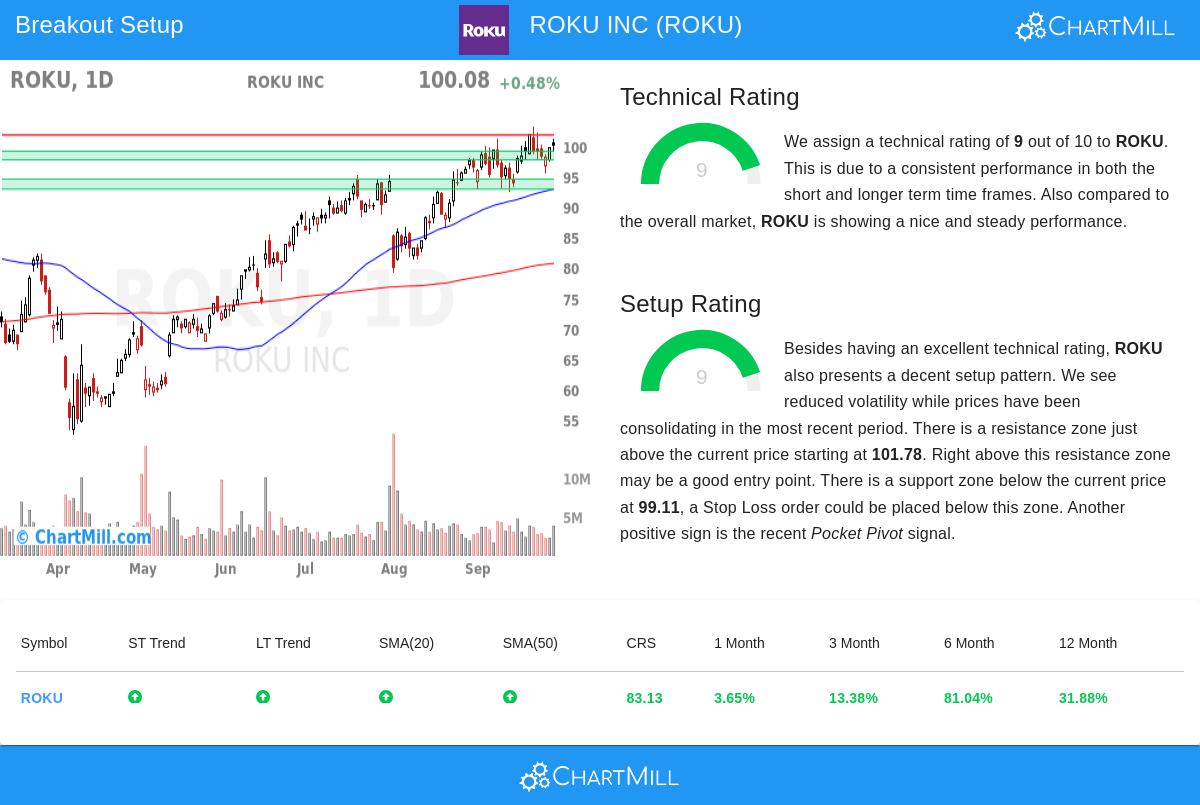
ROKU INC (NASDAQ:ROKU) shows very good technical features based on the ChartMill Technical Report, which gives the stock a near-maximum technical grade of 9 out of 10. This high mark represents several positive technical elements that match the breakout screening method's focus on finding stocks with clear upward momentum.
Important technical positives contain:
- Both long-term and short-term trends are clearly upward
- The stock is trading close to its 52-week high of $104.96
- Steady placement above all main moving averages (20-day: $97.70, 50-day: $92.86, 100-day: $85.78, 200-day: $80.66)
- Good relative performance beating 83% of all stocks
- Significant six-month gain of 81.04%
These technical features are important for breakout methods since they show the stock keeps good institutional backing and clear upward momentum, raising the chance that any breakout from consolidation will follow the existing trend direction.
Setup Quality Evaluation
Besides its technical condition, Roku displays an equally good setup grade of 9, showing the stock has been consolidating in a set band while keeping its wider upward path. This mix of good technicals with consolidation makes the preferred situation breakout investors want.
The setup evaluation shows several positive features:
- Recent trading band between $92.41 and $103.16 displays managed volatility
- Several clear support areas, with the closest spanning from $97.69 to $99.11
- A distinct resistance area starting at $101.78
- Recent pocket pivot signal showing institutional buying
- Present price placement near the top of the consolidation band
For breakout traders, these setup features give clear reference points for trade management. The set resistance level offers a possible trigger point for entry, while the clear support areas give logical levels for stop-loss setting, making a good risk-reward situation.
Trade Structure Factors
The technical report indicates a possible breakout setup with an entry at $101.79, just above the noted resistance, and an exit at $97.68, below the closest support area. This structure makes a set risk of about 4.04%, which is a sensible risk measure for breakout methods. The setup's quality is also improved by the stock's average true range of 3.54%, showing the suggested stop distance matches normal daily volatility.
Traders should know that while the automated setup gives a structure, personal risk comfort and time frame may call for changes to entry and exit points. The existence of several support levels below the present price gives options in stop placement for those wanting either closer risk control or longer-term holdings.
Market Situation and Industry Placement
In the wider market setting where the S&P 500 keeps positive short and long-term trends, Roku's technical condition seems especially noteworthy. The stock shows above-average performance in the entertainment field, beating 68% of its similar companies. This sector-relative performance adds another confirmation layer to the stock's technical picture, suggesting its momentum is not just a result of general market trends but shows company-specific condition.
The mix of good absolute and relative performance measures backs the breakout screening idea that the top chances often come from stocks showing leadership during positive market situations.
For investors looking for similar technical breakout chances, more screening results can be found using the Technical Breakout Setups screener, which methodically finds stocks mixing high technical grades with quality setup patterns.
Disclaimer: This evaluation is based on technical indicators and automated screening results and should not be taken as investment advice. Trading carries significant risk, and people should do their own research and talk with financial advisors before making investment choices. Past performance does not ensure future outcomes.