
Biotechnology firm AVIDITY BIOSCIENCES INC (NASDAQ:RNA) is currently presenting a notable technical profile, aligning with criteria often sought by momentum and breakout-focused investors. The stock recently surfaced through a systematic screen designed to identify securities exhibiting both sound underlying technical health and a high-quality consolidation pattern, key ingredients for potential breakout opportunities. This approach emphasizes selecting stocks that are not only in established uptrends but are also positioned at actionable entry points, minimizing chase scenarios and optimizing risk-reward setups.
Technical Strength and Trend Consistency
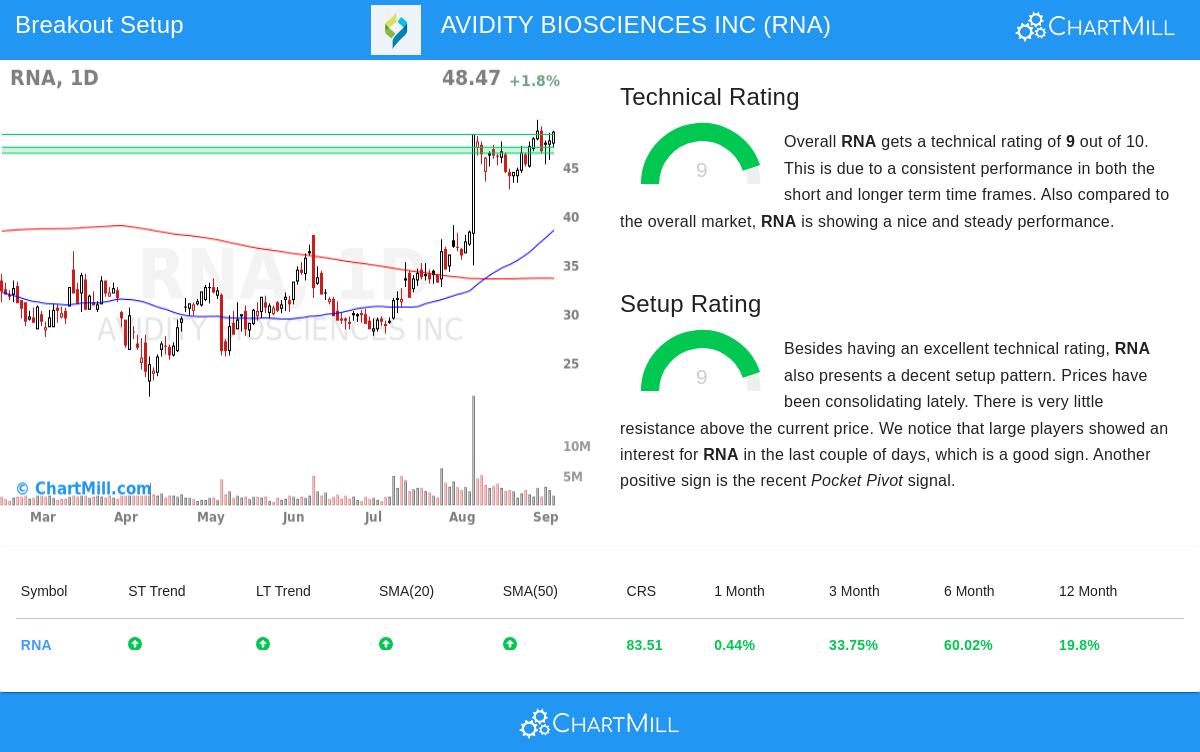
AVIDITY BIOSCIENCES displays solid technical characteristics, scoring a 9 out of 10 on the ChartMill Technical Rating scale. This high score reflects strength across multiple timeframes and technical indicators. Several factors contribute to this rating:
- Both the short-term and long-term trends are positive, indicating sustained buying interest.
- The stock is trading above key moving averages (20-day, 50-day, and 100-day SMAs), which are all rising, confirming bullish momentum.
- It demonstrates strong relative strength, outperforming 75% of stocks in the Biotechnology industry and 83% of all stocks in the market over the past year.
These elements are critical for the breakout strategy because they help ensure the stock is in a confirmed uptrend, increasing the probability that a breakout will lead to further gains rather than a false signal.
Setup Quality and Consolidation Pattern
Equally important, RNA earns a Setup Rating of 9, indicating it is emerging from a tight consolidation phase, a common precursor to significant price moves. The setup analysis highlights several encouraging signs:
- Prices have been trading in a narrow range recently, forming a bull flag pattern, which often resolves with a continuation of the prior uptrend.
- There is very little resistance above the current price, suggesting ample room for upward movement if a breakout occurs.
- Recent market activity shows involvement from large players, and a Pocket Pivot signal was observed, both typically interpreted as institutional accumulation.
This combination of a high-quality setup with strong underlying technicals is precisely what the breakout methodology aims to identify. It suggests the stock is not only trending well but is also at an optimal point for entry, with clearly defined support levels for managing risk.
Support Levels and Trade Structure
The technical report outlines multiple support zones, providing a structured framework for positioning stops and sizing positions. Key support levels include:
- A horizontal support at $48.26
- A stronger support zone between $46.34 and $46.96, formed by a confluence of moving averages and trendlines
- Additional supports at $44.01, $41.42, and lower, offering fallback levels for longer-term holders
These support levels allow traders to place stops with precision, an essential component of risk-managed breakout trading.
Market Context and Outlook
RNA’s technical profile is further bolstered by a favorable broader market environment. The S&P 500 is in a positive trend both short- and long-term, providing a supportive backdrop for breakout plays in individual stocks. For a clinical-stage biotech company like Avidity, which is advancing RNA-based therapeutics for rare diseases, positive market sentiment can amplify interest during technical breakouts, though fundamental developments remain a key driver.
Interested investors can explore more breakout candidates daily through the Technical Breakout Setups screen, which continuously scans for stocks exhibiting high technical and setup ratings.
For a deeper look into the technicals of AVIDITY BIOSCIENCES, the full ChartMill Technical Report offers detailed analysis and charts.
,
Disclaimer: This article is for informational purposes only and does not constitute investment advice, a recommendation, or an offer to buy or sell any securities. Trading stocks involves risk, including the possible loss of principal. Always conduct your own research and consider your financial situation, risk tolerance, and investment objectives before making any investment decisions.