For investors focused on technical analysis, identifying stocks that are both fundamentally sound and set for a near-term price move is a constant goal. One systematic method involves screening for stocks with good underlying technical condition that are also forming tight consolidation patterns, hinting at a possible breakout. This method uses two proprietary metrics from ChartMill: the Technical Rating, which measures the overall condition and trend of a stock, and the Setup Quality Rating, which evaluates the state of its current price pattern for a possible entry. The aim is to find leading stocks that are pausing before their next advance.
A recent scan using this method has highlighted Raymond James Financial Inc (NYSE:RJF) as a candidate for further examination. The financial services firm, which provides wealth management, investment banking, and asset management services, is currently showing a notable technical profile that fits the breakout screening criteria.
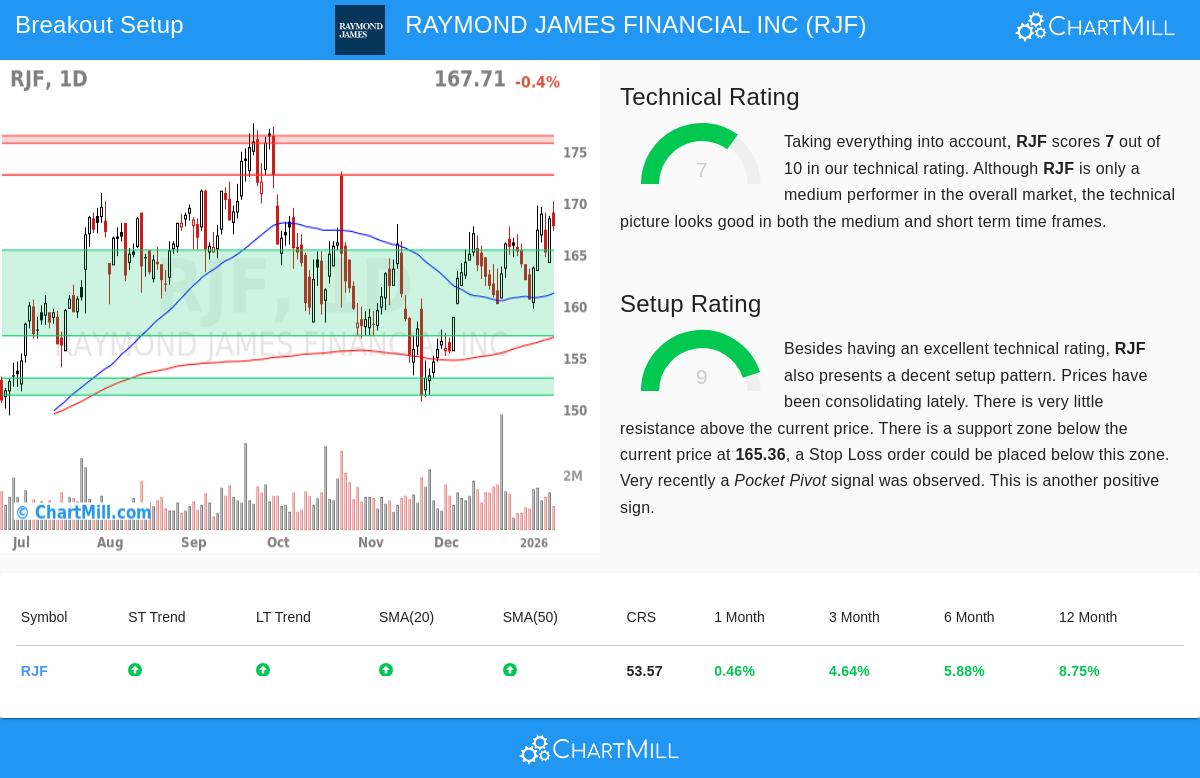
Technical Strength: A Sound Base
The first part of the breakout screen is a high Technical Rating, which confirms the stock is in a definite uptrend and shows relative strength. Raymond James Financial receives a good rating of 7 out of 10, signaling a stock in sound technical condition. A close look at the full technical report shows the main reasons for this score:
- Trend Alignment: Both the long-term and short-term trends for RJF are rated as positive. This agreement across timeframes is a clear sign of a continuing uptrend and lowers the chance of mixed signals.
- Moving Average Support: The stock is trading above its important moving averages (20, 50, 100, and 200-day), and all these averages are rising. This layered, rising support formation is a positive sign.
- Market-Relative Performance: While RJF is trading in the upper part of its own 52-week range, its yearly performance puts it ahead of about 53% of all stocks. This indicates it is performing similarly to or a bit better than the wider market, which is also in a positive trend.
This mix of positive trends and supportive moving averages gives the needed "technical condition" that the screening method looks for. A stock with a poor or falling technical rating would be more likely to fail a breakout try, making this base condition important.
Setup Quality: The Pause Before the Advance
A strong trend by itself is not a buy signal; entering a stock that has just made a big, extended move is hazardous. This is where the Setup Quality Rating is key. It finds times of consolidation or "tight" trading, which frequently come before the next price move. Raymond James Financial does well here with a high Setup Rating of 9.
The technical report details why the current pattern is of interest:
- Price Consolidation: Over the last month, RJF has been trading in a set range between about $159.64 and $170.12. The report states that "prices have been consolidating recently, this may present a good entry opportunity." This pause lets the stock ease any overbought state and gather momentum for a possible breakout.
- Clear Support and Resistance: The analysis finds a clear support area between $157.07 and $165.36, made by a mix of trendlines and moving averages. Just above the current price, resistance is seen around $172.64. This makes a well-marked trading range with clear levels for stop-loss placement (below support) and breakout confirmation (above resistance).
- Supportive Volume Action: A positive signal mentioned in the report is a recent "Pocket Pivot" signal, which is a volume-based sign pointing to accumulation by larger participants during the consolidation phase. This can add confidence to the setup.
The high Setup Rating verifies that RJF is not only trending but is in a specific stage where risk can be clearly defined, and a possible breakout level is visible. This directly answers the "when" to buy question that the overall strategy tries to solve.
A Sample Trading Plan
From this analysis, the technical report suggests a possible trading plan. It proposes an entry on a breakout above the $172.64 resistance level, with a stop-loss order placed below the recent range at $159.63. This would set a risk of about 7.5% on the trade itself. It is important to note that this is an example made from the technical levels; investors must always decide their own entry, exit, and position size based on their personal risk tolerance and plan.
Finding More Ideas
The case of Raymond James Financial shows how mixing technical condition with setup quality can find possible ideas. This screening process can be used daily to the wider market to find new candidates. For investors interested in seeing the current list of stocks meeting similar technical breakout criteria, the screen is available here: Technical Breakout Setups Screen.
Disclaimer: This article is for informational purposes only and does not constitute investment advice, a recommendation, or an offer or solicitation to buy or sell any securities. The analysis is based on technical data and automated reports. All investing involves risk, including the potential loss of principal. Past performance is not indicative of future results. Always conduct your own research, consider your financial situation and risk tolerance, and consult with a qualified financial advisor before making any investment decisions.