
Investors looking for companies with both solid fundamental growth traits and positive technical patterns often use a two-part analysis method. This approach mixes quantitative fundamental measures with technical chart study to find possible opportunities. The plan centers on stocks showing healthy revenue and earnings increases while keeping good financial condition and earnings. These fundamental traits are then matched with technical formations indicating possible price moves upward, forming a full investment view that looks at both the company's inherent worth and market timing factors.
Fundamental Growth Review
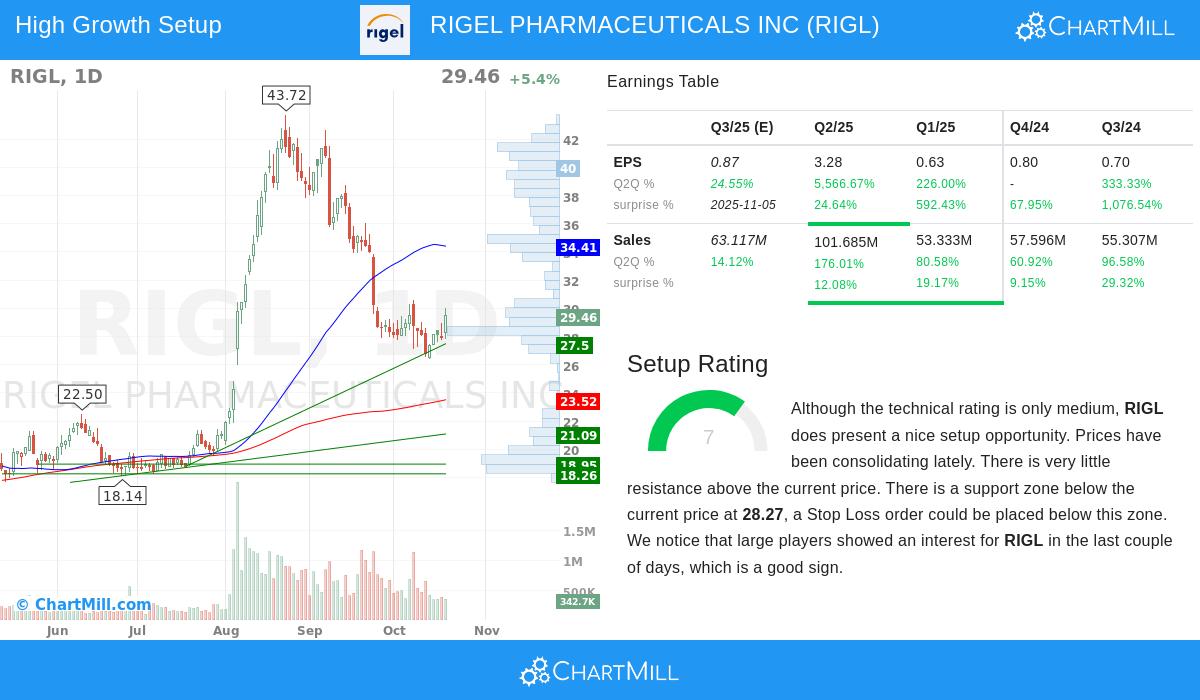
RIGEL PHARMACEUTICALS INC (NASDAQ:RIGL) shows notable growth measures that fit the screening requirements. The company's fundamental growth score of 7/10 shows solid past results and good future outlook. The biotechnology company has posted strong increases in important financial numbers:
- Revenue increase of 105.62% over the last year
- Earnings per share growth of 729.07% each year
- Three-year revenue growth averaging 24.77% per year
- Estimated future EPS growth of 29.86% each year
- Forecasted revenue growth of 14.40% per year
These growth numbers are much higher than industry norms and back the company's label as a solid growth candidate. The outstanding earnings growth is especially noticeable, showing the company is effectively turning revenue gains into net profitability. This matches the growth investment thinking that favors companies showing faster increases in both total revenue and net earnings.
Valuation and Financial Condition
Even with the strong growth path, RIGL keeps good valuation numbers that set it apart from many growth stocks selling at high multiples. The company's valuation score of 10/10 points to its attractive pricing next to both industry counterparts and wider market measures:
- Price-to-Earnings ratio of 5.45 next to industry average of 66.80
- Price-to-Forward-Earnings ratio of 7.65 compared to industry average of 34.27
- Enterprise Value to EBITDA ratio better than 98.88% of industry peers
- Price-to-Free-Cash-Flow ratio more favorable than 98.50% of rivals
The company's financial condition score of 6/10 and profitability score of 6/10 show acceptable operational steadiness. While the Altman-Z score brings up some points to note, the debt-to-free-cash-flow ratio of 0.91 indicates the company can manage its debts without trouble. This pairing of solid growth with fair valuation tackles a frequent issue in growth investing, finding companies with growth ability that are not already valued for best-case outcomes.
Technical Formation Study
The technical view for RIGL displays encouraging features that add to the solid fundamental story. With a technical score of 6/10 and formation score of 7/10, the stock offers a possibly good risk-return arrangement. The technical study shows several notable formations:
- Long-term direction stays positive even with recent sideways movement
- Stock did better than 94% of all market stocks over the past year
- Present trading area between $26.38 and $35.30 with a floor at $28.27
- Little price blockage above present price levels
- Recent trading activity shows larger investor attention
The formation indicates a possible price rise above the recent sideways range, with a clear support level giving a sensible stop-loss point. This technical arrangement fits the screening method's aim of finding growth stocks that are both fundamentally healthy and technically set for possible upward price action.
Investment Points
The pairing of RIGL's fundamental growth picture and technical formation makes a noteworthy example in two-part analysis investing. The company's solid revenue and earnings growth, along with good valuation numbers, meets the fundamental needs for growth investing. At the same time, the technical pattern suggests the stock could be moving out of a resting period with little price blockage above.
For investors using this method, RIGL stands for the kind of find that balances growth chance with specific risk limits. The fundamental analysis report gives a close look at the company's financial numbers, while the technical analysis report gives a view on price behavior and possible entry levels.
Investors wanting to find other picks joining solid growth fundamentals with positive technical formations can look at more options using our specialized stock screener.
Disclaimer: This article gives objective study based on given data and should not be taken as investment guidance. Investors should do their own research and think about their personal money situation before making investment choices. Past results do not ensure future outcomes, and all investments have risk including possible loss of original money.