
Our stock screening tool has identified RADIAN GROUP INC (NYSE:RDN) as a strong dividend contender with robust fundamentals. RDN exhibits commendable financial health and profitability, all while offering a sustainable dividend. Let's delve into each aspect below.
Dividend Examination for RDN
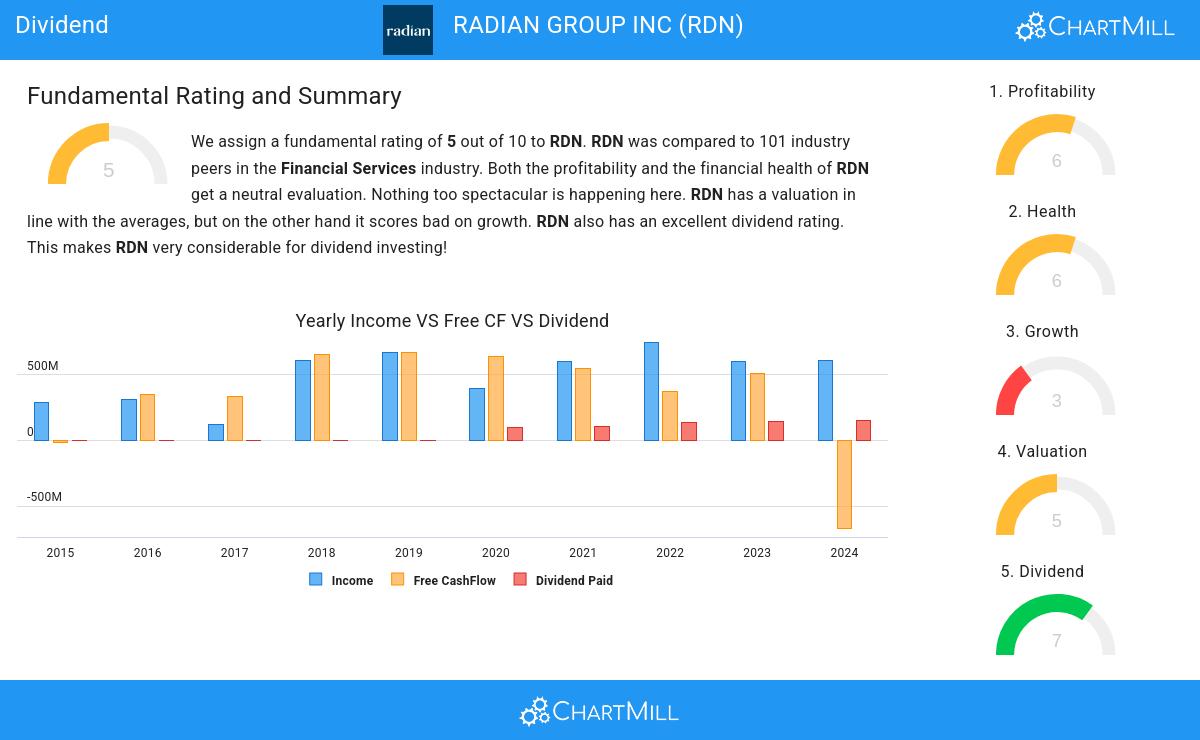
ChartMill employs its own Dividend Rating system for all stocks. This score, on a scale of 0 to 10, is determined by evaluating different dividend factors, such as yield, historical performance, dividend growth, and sustainability. RDN has been assigned a 7 for dividend:
- Compared to an average industry Dividend Yield of 5.01, RDN pays a bit more dividend than its industry peers.
- RDN's Dividend Yield is a higher than the S&P500 average which is at 2.44.
- The dividend of RDN is nicely growing with an annual growth rate of 151.22%!
- RDN has been paying a dividend for at least 10 years, so it has a reliable track record.
- RDN has not decreased its dividend for at least 10 years, so it has a reliable track record of non decreasing dividend.
- RDN pays out 25.14% of its income as dividend. This is a sustainable payout ratio.
Looking at the Health
ChartMill employs its own Health Rating for stock assessment. This rating, ranging from 0 to 10, is calculated by examining various liquidity and solvency ratios. In the case of RDN, the assigned 6 reflects its health status:
- The Altman-Z score of RDN (1.97) is better than 75.25% of its industry peers.
- A Debt/Equity ratio of 0.50 indicates that RDN is not too dependend on debt financing.
- A Current Ratio of 3.42 indicates that RDN has no problem at all paying its short term obligations.
- Looking at the Current ratio, with a value of 3.42, RDN belongs to the top of the industry, outperforming 88.12% of the companies in the same industry.
- RDN has a Quick Ratio of 3.42. This indicates that RDN is financially healthy and has no problem in meeting its short term obligations.
- With an excellent Quick ratio value of 3.42, RDN belongs to the best of the industry, outperforming 89.11% of the companies in the same industry.
Analyzing Profitability Metrics
ChartMill's Profitability Rating offers a unique perspective on stock analysis, providing scores from 0 to 10. These ratings consider a wide range of profitability metrics and margins, both in comparison to industry peers and on their own merits. For RDN, the assigned 6 is a significant indicator of profitability:
- The Return On Assets of RDN (6.98%) is better than 86.14% of its industry peers.
- RDN's Return On Equity of 13.07% is fine compared to the rest of the industry. RDN outperforms 66.34% of its industry peers.
- RDN's Return On Invested Capital of 8.25% is fine compared to the rest of the industry. RDN outperforms 78.22% of its industry peers.
- RDN has a better Profit Margin (46.85%) than 92.08% of its industry peers.
- The Operating Margin of RDN (70.27%) is better than 93.07% of its industry peers.
- RDN's Operating Margin has improved in the last couple of years.
Our Best Dividend screener lists more Best Dividend stocks and is updated daily.
For an up to date full fundamental analysis you can check the fundamental report of RDN
Keep in mind
This article should in no way be interpreted as advice. The article is based on the observed metrics at the time of writing, but you should always make your own analysis and trade or invest at your own responsibility.