
Technical breakout strategies focus on spotting stocks with solid momentum that are pausing before their next rise. This method uses two main measures: the ChartMill Technical Rating, which checks a stock's trend strength, and the Setup Quality Rating, which looks at whether the stock is forming a good base pattern. Stocks with high scores in both areas often offer good risk-reward chances when they move out of consolidation zones.
QXO INC (NYSE:QXO), a technology-driven building products distributor, currently displays traits that might appeal to technical traders. The stock's Technical Rating of 7 points to decent trend strength, while its Setup Rating of 9 hints at a well-formed consolidation pattern.
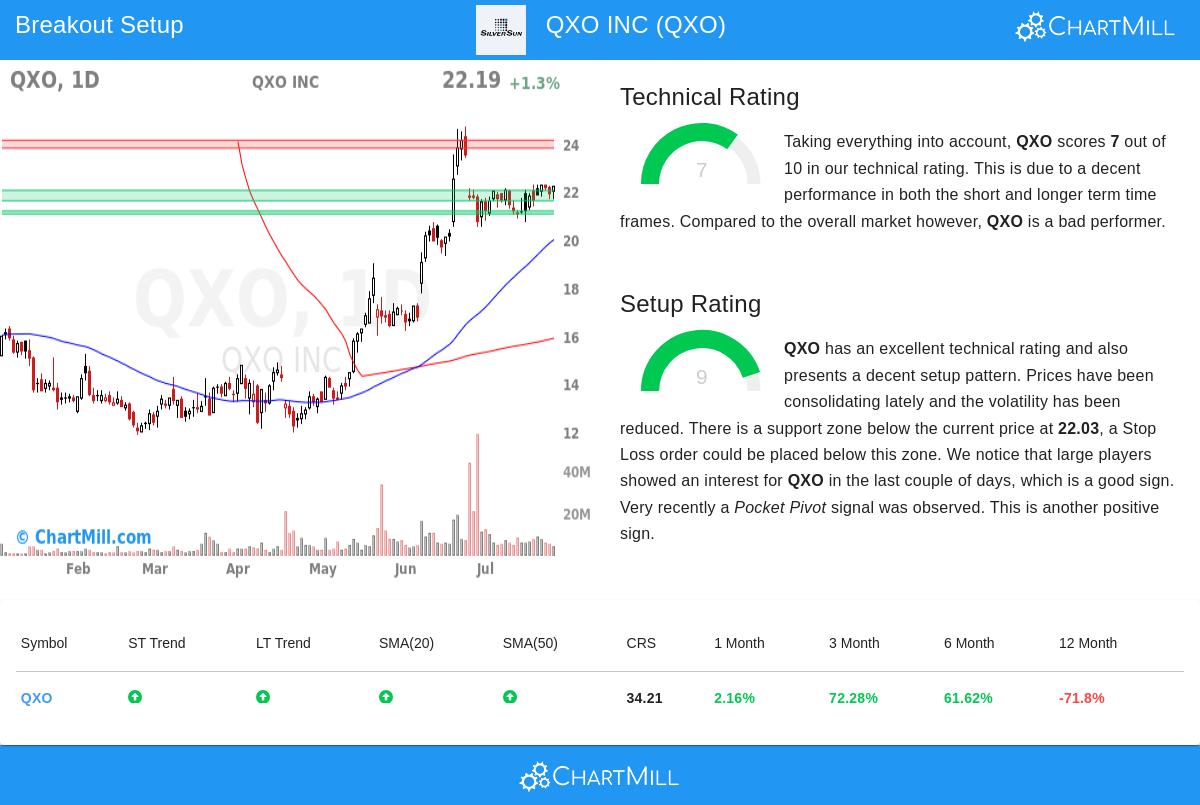
Technical Strength Notes
- The stock displays positive trends in both short-term and long-term periods, a crucial factor for breakout candidates. This dual confirmation boosts confidence in the stock's direction.
- Moving averages suggest a bullish outlook, with the 20-day ($21.60), 50-day ($19.98), 100-day ($16.73), and 200-day ($15.87) SMAs all rising and aligned correctly.
- Recent performance shows strong momentum, with 3-month and 6-month gains of 72.28% and 61.62%, though the stock remains far below its 52-week high of $77.
Setup Quality Review
- The Setup Rating of 9 reflects tight consolidation, with the stock trading between $20.52 and $22.28 over the past month while testing the upper limit.
- Multiple support levels sit below the current price, including a solid zone from $21.60 to $22.03 formed by moving averages and trendlines, offering a logical spot for stop-loss orders.
- Recent signals indicate institutional interest, shown by the Effective Volume metric and a Pocket Pivot signal, both suggesting larger players are buying.
- Volatility has dropped during the consolidation phase, as seen in the 3.22% Average True Range, typical of stocks forming bases before possible breakouts.
Trade Setup Points
The technical report indicates:
- A possible entry at $22.29, just above recent resistance
- A stop-loss at $21.59, below the nearest support zone
- This creates a favorable risk-reward ratio with only 3.14% downside risk
While the technical outlook looks promising, investors should note that QXO lags behind both its industry peers (trailing 74% of Trading Companies & Distributors stocks) and the broader market (behind 66% of all stocks). This relative weakness calls for caution despite the appealing setup.
For traders looking for similar breakout chances, the Technical Breakout Setups screen offers daily updates on stocks meeting these criteria. A deeper technical review of QXO is available in the full technical report.
Disclaimer: This analysis is for informational purposes only and should not be seen as investment advice. Always do your own research and assess your risk tolerance before making investment choices.