
For investors using technical analysis, finding stocks in a strong uptrend and forming a constructive price pattern is a key part of breakout trading. One method for this is the ChartMill Technical Breakout Setups screen, which finds stocks with two main proprietary scores: a high Technical Rating to confirm a stock's strength and momentum, and a high Setup Quality Rating to find periods of consolidation that often come before a new advance. This pairing tries to answer the important questions of which stock to buy and when to buy it, looking for chances where a technically good stock is preparing for its next possible move.
A recent scan using this method has pointed to QuidelOrtho Corp (NASDAQ:QDEL) as a candidate that deserves more attention from a technical view. The diagnostics company, which focuses on immunoassay and molecular testing, shows a chart that fits the criteria for a possible breakout setup.
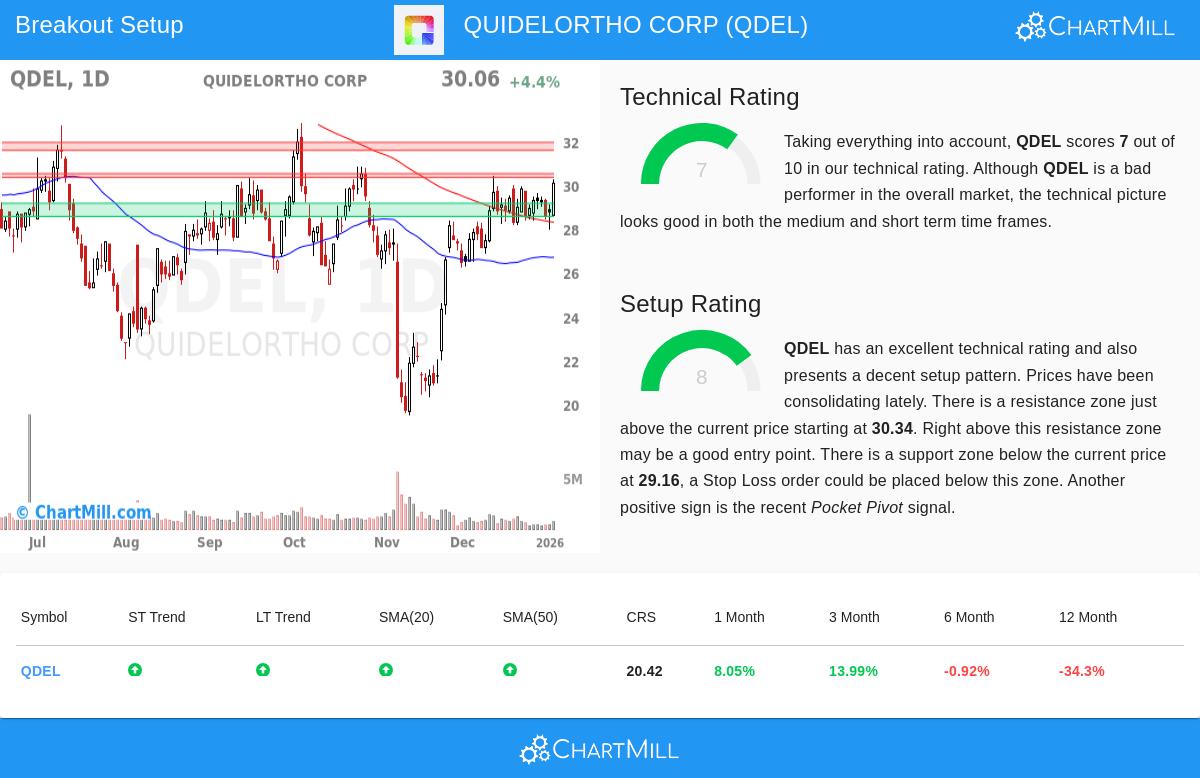
Looking at Technical Strength
The base of any breakout trade is the basic health and direction of the stock's trend. QuidelOrtho’s ChartMill Technical Rating of 7 out of 10 shows a stock in a confirmed uptrend, as ratings of 7 and above are usually given to stocks showing positive momentum. This score comes from a review of multiple timeframes and technical points. The report lists several positive parts of this rating:
- Trend Alignment: Both the short-term and long-term trends for QDEL are now rated as positive. This agreement across timeframes is a strong sign of continued buying pressure.
- Moving Average Support: The stock is trading above its important short-term moving averages, including the 20-day and 50-day SMAs, which are also rising. This arrangement often gives active support on pullbacks.
- Recent Performance: Over the last one and three-month periods, QDEL has gained about 8% and 14%, respectively, showing recent upward momentum.
However, the report also gives important details. While the stock's own trends are positive, its relative strength is a noted weak point; it has done worse than about 80% of the wider market over the past year and is trading in the middle of its 52-week range while main indexes like the S&P 500 are near highs. This highlights that the technical rating mainly measures the stock's own price action health, and QDEL’s strength is more of a recovery within its own chart than market leadership.
Looking at the Setup Quality
A strong trend by itself does not make a good entry. Buying into an extended move has the danger of an immediate pullback. This is where the Setup Quality Rating becomes important, as it finds periods of consolidation or "tight" price action that can give lower-risk entry points. QDEL gets a solid Setup Rating of 8, indicating a high-quality consolidation pattern.
The technical report explains why this score was given and what it means for a possible trade:
- Consolidation Range: Over the past month, QDEL has traded within a set range between about $26.84 and $30.39. It is now testing the upper limit of this range, which is typical breakout action.
- Clear Support and Resistance: The analysis finds a well-defined support area between $28.56 and $29.16, made by a combination of moving averages and trendlines. Just above the current price, a resistance area is between $30.34 and $30.51.
- Pocket Pivot Signal: A recent "Pocket Pivot" signal, a volume-backed price move showing accumulation, adds a positive detail to the setup, suggesting institutional buying interest may be starting.
For a trader, this structure makes a clear, rules-based plan. The high setup rating confirms the stock is not overextended but is instead tightening near resistance. A clear move above the noted resistance area could signal a breakout from the consolidation, possibly opening the way for more gains. The nearby support area gives a logical level to place a protective stop-loss order, setting the trade's risk from the start.
A Possible Trading Plan
Based on this technical structure, the ChartMill analysis presents a sample trading setup. An entry could be thought about on a break above the resistance at about $30.52, with a stop-loss placed below the support area near $28.55. This would limit the sample worst-case risk to about 6.5% on the trade. It is important to note that this is an automated example for explanation, not a suggestion. Every investor must decide their own entry, exit, and position size based on their personal risk tolerance and study.
Finding More Ideas
The case of QuidelOrtho shows how pairing Technical and Setup Ratings can filter for charts ready for action. For investors wanting to find similar possible breakout setups each day, the Technical Breakout Setups screen is a useful starting point. It regularly searches the market for stocks that, like QDEL, show both technical strength and a constructive price pattern, doing the initial work to present a selected list for more review.
Disclaimer: This article is for information and learning only. It is not meant as investment advice, a suggestion, or an offer or solicitation to buy or sell any securities. The study presented is based on technical indicators and past data, which are not promises of future results. Investing has risk, including the possible loss of principal. Always do your own research and think about talking with a qualified financial advisor before making any investment choices.