
Uncover the potential of PILGRIM'S PRIDE CORP (NASDAQ:PPC) as our stock screener's choice for an undervalued stock. PPC maintains a strong financial position and offers an appealing valuation. We'll delve into the specifics below.
Valuation Examination for PPC
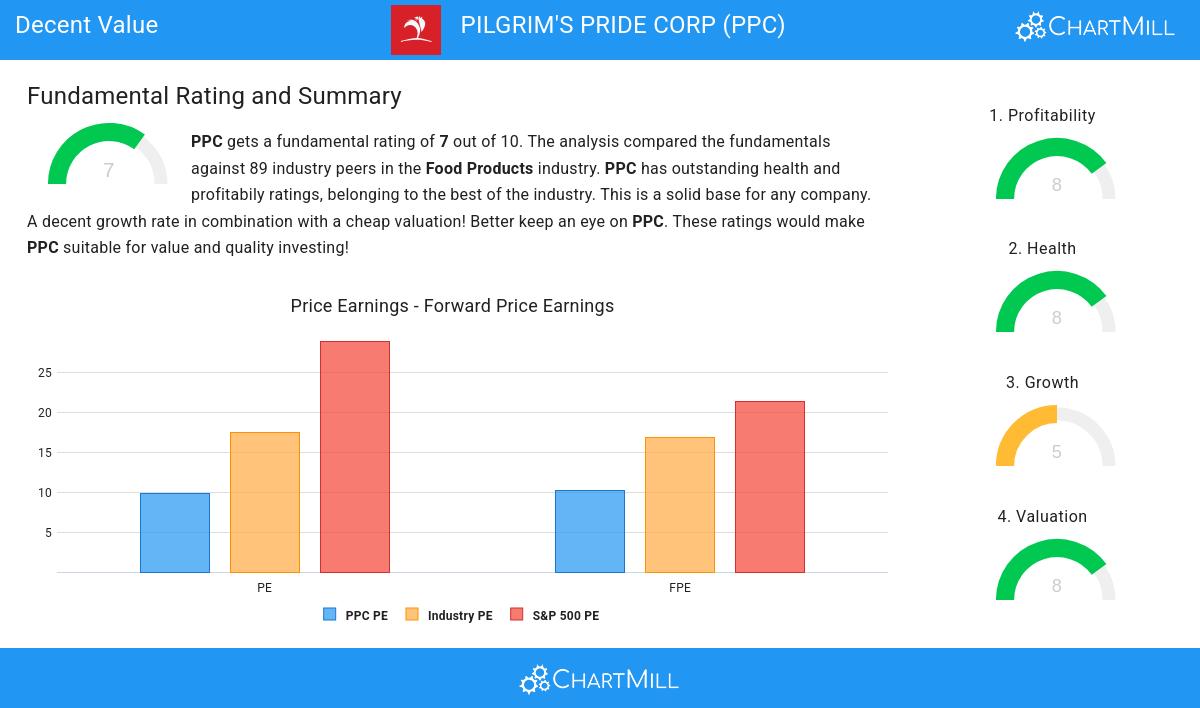
ChartMill employs its own Valuation Rating system for all stocks. This score, ranging from 0 to 10, is determined by evaluating different valuation factors, including price to earnings and free cash flow, both in absolute terms and relative to the market and industry. PPC has earned a 8 for valuation:
- A Price/Earnings ratio of 9.84 indicates a reasonable valuation of PPC.
- Based on the Price/Earnings ratio, PPC is valued cheaper than 83.15% of the companies in the same industry.
- The average S&P500 Price/Earnings ratio is at 28.87. PPC is valued rather cheaply when compared to this.
- With a Price/Forward Earnings ratio of 10.24, the valuation of PPC can be described as very reasonable.
- PPC's Price/Forward Earnings ratio is rather cheap when compared to the industry. PPC is cheaper than 91.01% of the companies in the same industry.
- PPC is valuated cheaply when we compare the Price/Forward Earnings ratio to 21.38, which is the current average of the S&P500 Index.
- PPC's Enterprise Value to EBITDA ratio is rather cheap when compared to the industry. PPC is cheaper than 80.90% of the companies in the same industry.
- Compared to the rest of the industry, the Price/Free Cash Flow ratio of PPC indicates a rather cheap valuation: PPC is cheaper than 83.15% of the companies listed in the same industry.
- PPC has an outstanding profitability rating, which may justify a higher PE ratio.
Profitability Examination for PPC
ChartMill's Profitability Rating offers a unique perspective on stock analysis, providing scores from 0 to 10. These ratings consider a wide range of profitability metrics and margins, both in comparison to industry peers and on their own merits. For PPC, the assigned 8 is a significant indicator of profitability:
- PPC has a better Return On Assets (10.20%) than 92.13% of its industry peers.
- Looking at the Return On Equity, with a value of 25.63%, PPC belongs to the top of the industry, outperforming 94.38% of the companies in the same industry.
- The Return On Invested Capital of PPC (16.32%) is better than 95.51% of its industry peers.
- PPC had an Average Return On Invested Capital over the past 3 years of 12.54%. This is above the industry average of 9.00%.
- The 3 year average ROIC (12.54%) for PPC is below the current ROIC(16.32%), indicating increased profibility in the last year.
- The Profit Margin of PPC (6.08%) is better than 76.40% of its industry peers.
- In the last couple of years the Profit Margin of PPC has grown nicely.
- The Operating Margin of PPC (8.95%) is better than 73.03% of its industry peers.
- In the last couple of years the Operating Margin of PPC has grown nicely.
- PPC's Gross Margin has improved in the last couple of years.
Deciphering PPC's Health Rating
ChartMill utilizes a Health Rating to assess stocks, scoring them on a scale of 0 to 10. This rating takes into account a variety of liquidity and solvency ratios, both in absolute terms and in comparison to industry peers. PPC has earned a 8 out of 10:
- PPC has an Altman-Z score of 4.06. This indicates that PPC is financially healthy and has little risk of bankruptcy at the moment.
- Looking at the Altman-Z score, with a value of 4.06, PPC belongs to the top of the industry, outperforming 80.90% of the companies in the same industry.
- The Debt to FCF ratio of PPC is 2.12, which is a good value as it means it would take PPC, 2.12 years of fcf income to pay off all of its debts.
- PPC has a better Debt to FCF ratio (2.12) than 80.90% of its industry peers.
- Even though the debt/equity ratio score it not favorable for PPC, it has very limited outstanding debt, so we won't put too much weight on the DE evaluation.
- PPC has a Current Ratio of 2.01. This indicates that PPC is financially healthy and has no problem in meeting its short term obligations.
- The Current ratio of PPC (2.01) is better than 61.80% of its industry peers.
- Looking at the Quick ratio, with a value of 1.31, PPC is in the better half of the industry, outperforming 73.03% of the companies in the same industry.
Growth Assessment of PPC
ChartMill assigns a proprietary Growth Rating to each stock. The score is computed by evaluating various growth aspects, like EPS and revenue growth. We take into account the history as well as the estimated future numbers. PPC was assigned a score of 5 for growth:
- PPC shows a strong growth in Earnings Per Share. In the last year, the EPS has been growing by 220.71%, which is quite impressive.
- PPC shows a strong growth in Earnings Per Share. Measured over the last years, the EPS has been growing by 27.16% yearly.
- PPC shows quite a strong growth in Revenue. Measured over the last years, the Revenue has been growing by 9.40% yearly.
Our Decent Value screener lists more Decent Value stocks and is updated daily.
For an up to date full fundamental analysis you can check the fundamental report of PPC
Keep in mind
This is not investing advice! The article highlights some of the observations at the time of writing, but you should always make your own analysis and invest based on your own insights.