
In this article, we'll take a closer look at INSULET CORP (NASDAQ:PODD) as a potential candidate for growth investing. While it's important for investors to conduct their own research, INSULET CORP has piqued our interest by appearing on our strong growth and breakout radar. Let's explore further.
A Closer Look at Growth for PODD
ChartMill assigns a Growth Rating to each stock, ranging from 0 to 10. This rating is determined by analyzing different growth elements, including EPS and revenue growth, spanning both historical and future figures. In the case of PODD, the assigned 9 reflects its growth potential:
- PODD shows a strong growth in Earnings Per Share. In the last year, the EPS has been growing by 22.43%, which is quite impressive.
- Measured over the past years, PODD shows a very strong growth in Earnings Per Share. The EPS has been growing by 79.24% on average per year.
- The Revenue has grown by 22.07% in the past year. This is a very strong growth!
- Measured over the past years, PODD shows a very strong growth in Revenue. The Revenue has been growing by 22.92% on average per year.
- Based on estimates for the next years, PODD will show a very strong growth in Earnings Per Share. The EPS will grow by 20.57% on average per year.
- The Revenue is expected to grow by 15.04% on average over the next years. This is quite good.
Evaluating Health: PODD
ChartMill employs a unique Health Rating system for all stocks. This rating, ranging from 0 to 10, is determined by analyzing various liquidity and solvency ratios. For PODD, the assigned 7 for health provides valuable insights:
- An Altman-Z score of 7.37 indicates that PODD is not in any danger for bankruptcy at the moment.
- PODD has a Altman-Z score of 7.37. This is amongst the best in the industry. PODD outperforms 87.43% of its industry peers.
- With an excellent Debt to FCF ratio value of 4.70, PODD belongs to the best of the industry, outperforming 81.68% of the companies in the same industry.
- PODD has a Current Ratio of 3.58. This indicates that PODD is financially healthy and has no problem in meeting its short term obligations.
- With a decent Current ratio value of 3.58, PODD is doing good in the industry, outperforming 63.87% of the companies in the same industry.
- A Quick Ratio of 2.76 indicates that PODD has no problem at all paying its short term obligations.
- PODD has a Quick ratio of 2.76. This is in the better half of the industry: PODD outperforms 63.35% of its industry peers.
What does the Profitability looks like for PODD
ChartMill's Profitability Rating offers a unique perspective on stock analysis, providing scores from 0 to 10. These ratings consider a wide range of profitability metrics and margins, both in comparison to industry peers and on their own merits. For PODD, the assigned 8 is a significant indicator of profitability:
- PODD's Return On Assets of 13.55% is amongst the best of the industry. PODD outperforms 95.29% of its industry peers.
- With an excellent Return On Equity value of 34.52%, PODD belongs to the best of the industry, outperforming 98.95% of the companies in the same industry.
- Looking at the Return On Invested Capital, with a value of 9.49%, PODD belongs to the top of the industry, outperforming 91.62% of the companies in the same industry.
- The last Return On Invested Capital (9.49%) for PODD is above the 3 year average (6.40%), which is a sign of increasing profitability.
- The Profit Margin of PODD (20.19%) is better than 93.72% of its industry peers.
- In the last couple of years the Profit Margin of PODD has grown nicely.
- The Operating Margin of PODD (14.91%) is better than 85.34% of its industry peers.
- In the last couple of years the Operating Margin of PODD has grown nicely.
- PODD's Gross Margin of 69.79% is fine compared to the rest of the industry. PODD outperforms 78.53% of its industry peers.
How does the Setup look for PODD
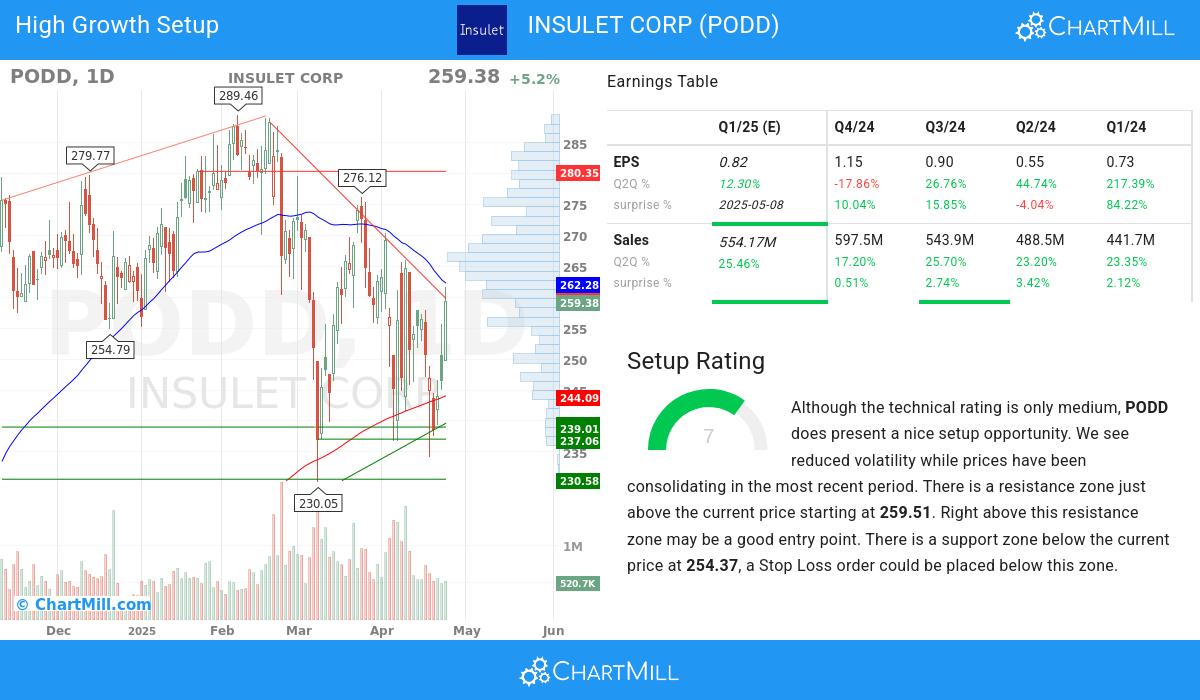
ChartMill also assign a Setup Rating to every stock. With this score it is determined to what extend the stock has been trading in a range in the recent days and weeks. This score also ranges from 0 to 10 and is updated daily. The setup score evaluates various short term technical indicators. PODD scores a 7 out of 10:
Although the technical rating is only medium, PODD does present a nice setup opportunity. Prices have been consolidating lately and the volatility has been reduced. There is a resistance zone just above the current price starting at 259.51. Right above this resistance zone may be a good entry point. There is a support zone below the current price at 254.37, a Stop Loss order could be placed below this zone.
Our Strong Growth screener lists more Strong Growth stocks and is updated daily.
Check the latest full fundamental report of PODD for a complete fundamental analysis.
For an up to date full technical analysis you can check the technical report of PODD
Disclaimer
Important Note: The content of this article is not intended as trading advice. It is essential to perform your own analysis and exercise caution when making trading decisions. The article presents observations created by automated analysis but does not guarantee any trading or investment outcomes. Always trade responsibly and make independent judgments.