
For investors who use charts and price action to guide their decisions, a methodical way to spot possible opportunities is important. One approach looks for stocks that are both showing good technical condition and building a positive price pattern, a pairing that can indicate a preparation for a new upward phase. This tactic centers on two specific metrics: the ChartMill Technical Rating, which judges the general condition and direction of a stock, and the ChartMill Setup Quality Rating, which examines the state of its present consolidation or base formation. The aim is to locate market leaders that are resting after a rise, providing a possible entry moment before a potential upward move.
Planet Fitness Inc - CL A (NYSE:PLNT) recently appeared from such a search, displaying a profile that technical investors may find interesting. The gym franchisor’s stock shows a mix of fundamental condition and a tightening price formation, indicating it could be getting ready for its next price move.
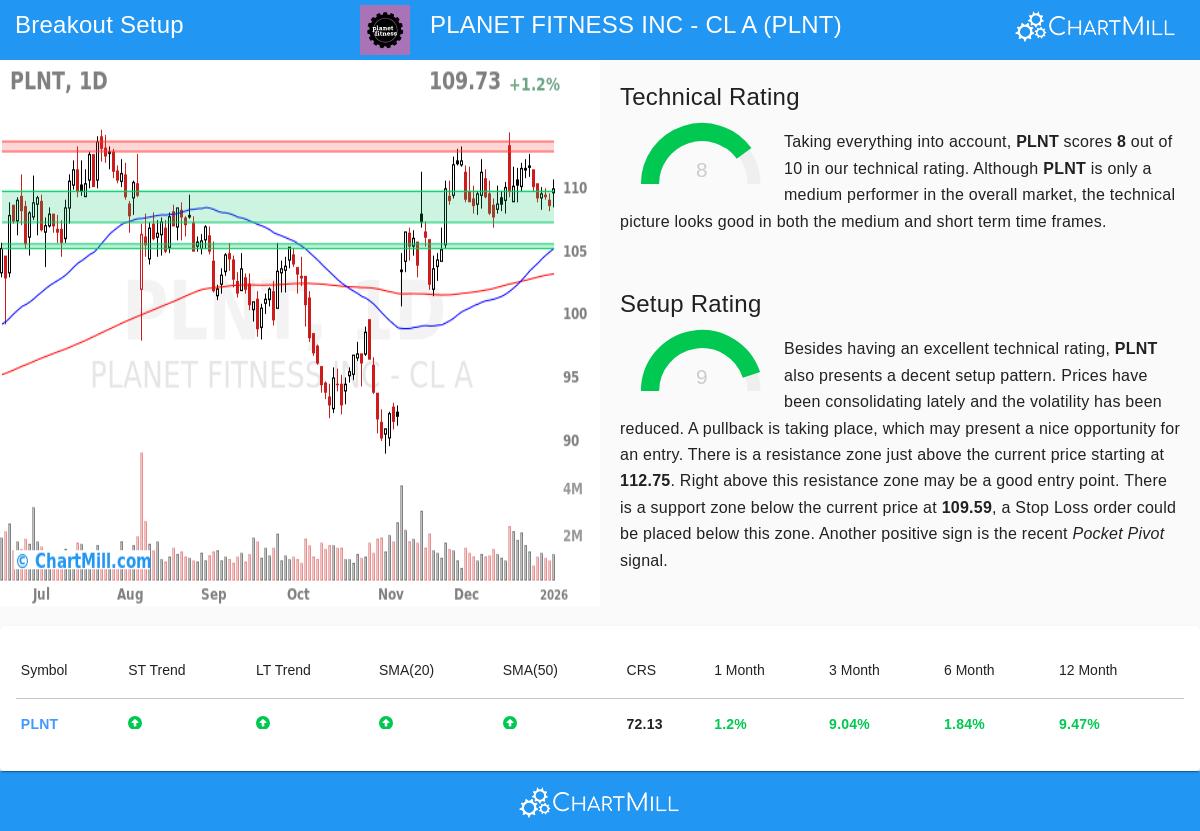
Examining the Technical Base
The first part of this breakout search method is finding stocks with good technical condition, as a solid fundamental trend raises the chance that a breakout will hold. Planet Fitness receives a firm Technical Rating of 8 out of 10, putting it clearly in an upward trend on ChartMill’s scale. A close look at the full technical report shows the reasons for this score.
- Trend Direction: Both the near-term and longer-term trends for PLNT are marked as positive, a united optimistic sign that gives a good setting.
- Moving Average Backing: The stock is priced above all its main simple moving averages (20, 50, 100, and 200-day), and each of these averages is itself in a rising pattern. This layered arrangement of support levels is a typical sign of a sound upward trend.
- Relative Performance: While the stock is doing better than 75% of similar companies in the Hotels, Restaurants & Leisure industry and has a yearly return better than 72% of the wider market, the report states it is somewhat behind the S&P 500’s recent peaks. This implies there could be room for improvement if the stock’s own positive pace continues.
This group of factors shows PLNT is not in a disorganized or poor condition but is instead displaying the traits of a stock in a clear upward trend, which is the necessary first condition for a promising breakout formation.
Judging the Setup State
A firm trend by itself is not a signal to buy; entering a stock that has already made a big, stretched move can be dangerous. This is where the second metric, the Setup Quality Rating, becomes important. It addresses the question of when to think about an entry by spotting times of consolidation or lower volatility. PLNT gets a very good 9 out of 10 on this measure.
The high score mirrors a positive pause in the stock’s rise. The technical report specifically states the stock is "forming a bull flag pattern" and "we see lower volatility while prices have been consolidating in the most recent period." This describes a situation where the stock is resting after a prior increase, often letting moving averages adjust and preparing for the next possible move.
Maintain parts adding to this high-state setup include:
- Clear Support and Resistance: The analysis finds a definite support area between $107.11 and $109.59, made by a meeting of trend lines and moving averages. Just above the present price sits a resistance area between $112.75 and $113.55. These set levels give clear points for risk control (placing a stop-loss below support) and for spotting a breakout (a move above resistance).
- Nearness to Important Levels: The stock’s present price is trading close to the high end of its recent range and near the found resistance, meaning it is not stretched but is instead testing a level that might start a new move.
- Supportive Behavior: A recent "Pocket Pivot" signal—a price increase on higher-than-normal volume—is mentioned as an extra positive note, implying institutional buying may be happening during this consolidation.
A Possible Technical Situation
From this analysis, the automated report proposes a specific trading idea. It suggests an entry point just above the 10-day moving average at $110.04, with a stop-loss order set below the nearby support area at $108.03. This would cap the theoretical worst-case risk on the trade to about 1.8%. It is important to know that this is an example created from the technical levels; investors should always do their own study to decide entry, exit, and position size that fit their own risk comfort and plan.
Locating Comparable Chances
Planet Fitness shows the kind of chance this search method is made to find: a stock with verified condition taking a pause before its next possible rise. For investors wanting to use this method to locate other possible breakout choices, new formations are found each day. You can review the present list of qualifying stocks by going to the Technical Breakout Setups screen.
Disclaimer: This article is for information only and does not make up investment advice, a suggestion, or an offer to buy or sell any security. The analysis uses technical metrics and automated reports. Investors should do their own research, think about their financial position and risk comfort, and talk with a qualified financial advisor before making any investment choices. Past results do not guarantee future outcomes.