
For investors aiming to achieve notable capital gains, a method that joins solid fundamental expansion with positive technical momentum can be an effective path. This process centers on finding firms that are not only increasing their earnings and sales at a better-than-average rate but are also displaying price behavior that hints at institutional buying and a possible move from a period of sideways trading. By selecting for stocks with high growth scores, good financial condition, and acceptable earnings, the method first secures a sound business base. It then adds technical study, searching for particular price formations that signal a stock is building energy for its next upward move, thus trying to enter as speed starts to increase.
Planet Fitness Inc - Class A (NYSE:PLNT) offers an example for this joined growth-and-momentum method. The franchisor and operator of fitness centers has shown a steady capacity to grow its presence and financial numbers, which is seen in its fundamental picture. At the same time, its stock chart displays a formation of trading in a narrow range near recent peaks, indicating a possible technical condition for further advance.
A Base of Solid Fundamental Expansion
The heart of the method needs a firm with clear and projected expansion, which is a main force for lasting stock gains. Planet Fitness’s fundamental report notes its force in this field, giving it a Growth Score of 7 out of 10. This number is formed on both past results and forward estimates.
- Past Results: Over the last year, PLNT has increased its Earnings Per Share (EPS) by 18.95% and its Sales by 14.39%. The longer-term direction is also good, with an average yearly EPS increase of 10.03% and sales increase of 11.40% over recent years.
- Forward Estimates: Experts forecast this speed to persist, with estimated yearly EPS increase of 17.23% and sales increase of 9.88% in the next years. Importantly, the EPS increase rate is forecast to rise compared to its past average.
This steady history and positive view are key for a growth stock, as they show the firm’s business plan—focused on low-cost, high-value fitness memberships and franchising—stays working and able to grow. While the firm does not give a dividend, putting earnings back into expansion is a trait of traditional growth stocks, fitting with the method’s focus on capital gains.
Supporting Fundamentals: Earnings and Financial Condition
A solid expansion narrative must be backed by a profitable business and a firm balance sheet to be lasting. PLNT’s fundamentals display an even picture here, with both Earnings and Financial Condition Scores at 6 out of 10.
- Earnings Strengths: The company has very good margins, with an Operating Margin of 29.37% that beats 96% of its industry group in Hotels, Restaurants & Leisure. Its Return on Invested Capital (ROIC) of 9.88% is also higher than the industry middle point.
- Financial Condition Points: The company displays good cash availability, with Current and Quick Ratios above 2.0, showing no near-term payment worries. Still, investors should see its Debt to Free Cash Flow ratio is elevated, which is typical for firms in a forceful growth stage but needs watching.
These scores in earnings and condition give the "acceptable" base the filtering method looks for. They indicate that the firm’s expansion is not being reached through careless outlays or by harming financial steadiness, lowering fundamental risk.
The Technical Condition: Placing for an Advance
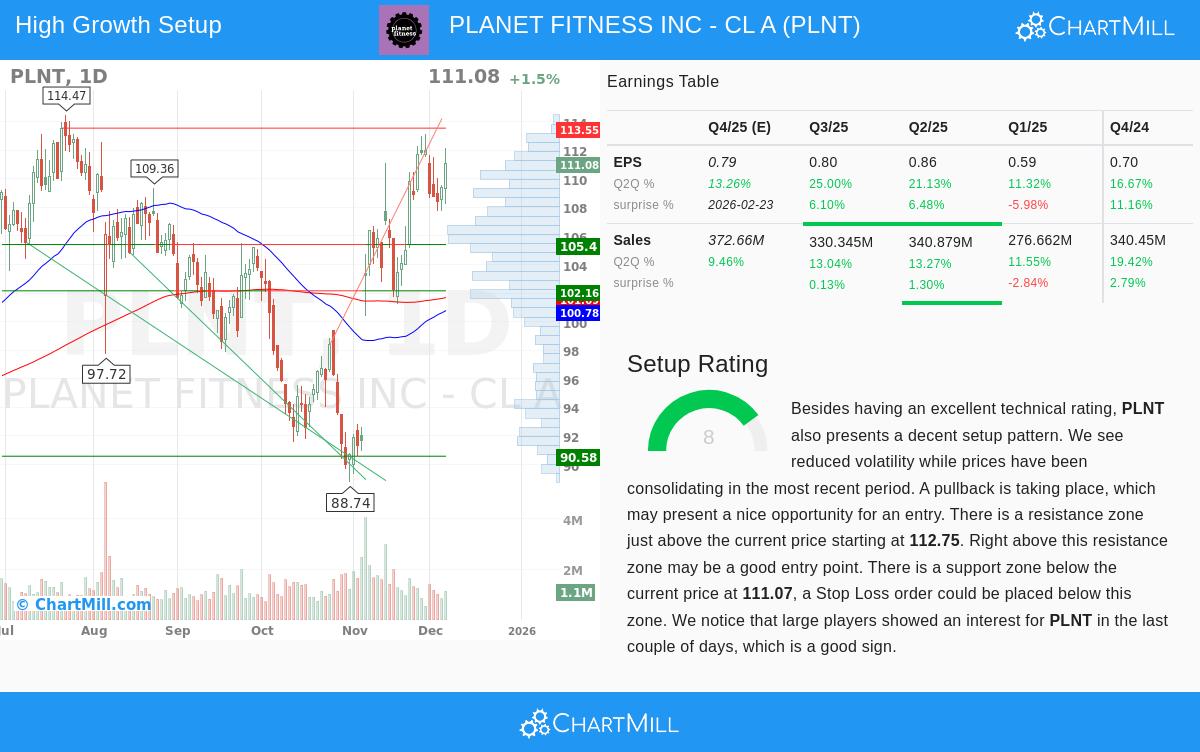
The second part of the method involves spotting a positive technical entry spot. PLNT’s technical study report shows a high score of 9 out of 10, with a specific Setup Score of 8. The report states the stock is now showing a "bull flag" formation—a period of sideways trading after a strong upward move, often seen as a halt before a possible further rise.
- Direction and Speed: Both the near-term and long-term directions for PLNT are positive. The stock is trading above its main moving averages (20, 50, 100, and 200-day SMAs), which are all climbing, confirming the upward direction structure.
- Market Comparison Strength: PLNT is doing better than 71% of the wider market and 83% of its industry group over the last year, a mark of comparative force that growth investors like.
- Sideways Trading and Floor: The stock has been trading in a narrow range near its 52-week peak. The technical study finds a clear floor area between $107.49 and $111.07, made by a mix of moving averages and trend lines. A ceiling area sits just above the present price, around $112.75 to $113.55.
This technical view fits with the method’s aim of finding strong growth stocks in a helpful technical place. The sideways trading above a solid floor, within a clear upward direction and showing comparative force, prepares for a possible advance if the stock can move past the nearby ceiling level.
Price Context
It is key to see that pure growth stocks often trade at high prices. PLNT’s Price Score of 2 shows this, with a Price-to-Earnings (P/E) ratio of 37.65. While costly compared to the wider S&P 500 average, it is similar to its own industry average. For growth-focused methods, a higher price can be acceptable if the firm’s earnings increase rate is high enough to quickly grow into its price. The forecast EPS increase rate gives some reason for this, though it stays a main point for investor thought.
Why This Join is Important
The link between the fundamental and technical reports is what makes this path tactical. The solid growth fundamentals give the reason for the stock to gain over time—the growing earnings and sales create inherent value. The positive technical condition and high score give the timing view, indicating that market players are seeing this value and the stock’s speed may be matching its fundamental story. It tries to prevent buying a good firm just before a technical drop, or following a technical advance in a firm with poor fundamentals.
For a close look at the fundamental numbers driving this study, you can check the full Fundamental Analysis Report for PLNT. To study the chart formations, floor/ceiling levels, and trade condition details, see the whole Technical Analysis Report for PLNT.
Planet Fitness Inc (PLNT) shows a stock that fits the needs of a joined growth-and-momentum filter. It displays a clear path of fundamental growth, backed by good earnings and sufficient financial condition. Technically, it is placed in a helpful period of sideways trading within a long-term upward direction, indicating possibility for its next upward stage. For investors using this method, PLNT stands as a candidate where business results and market price behavior seem to be in agreement.
Want to find other stocks that match this description? You can run the "Strong Growth Stocks with good Technical Setup Ratings" filter yourself to look for more possible chances. View the filter and its present results here.