
In the world of growth investing, combining a strict technical framework with a focus on fundamental momentum can be an effective method for spotting possible leaders. One example is the Mark Minervini strategy, which joins his specific Trend Template with a detailed examination of earnings and sales acceleration. The aim is to locate stocks that are not only in strong, confirmed uptrends but are also supported by companies showing solid and getting better business fundamentals. This two-part method tries to find securities where price strength is matched by the company's own growth, with the goal of taking part in the early to middle parts of a major price rise.
PARK AEROSPACE CORP (NYSE:PKE) recently appeared from a screen made to find stocks that meet both the technical rules of Minervini's Trend Template and the fundamental energy needed for high-growth momentum investing. We will look at how PKE fits with this joined strategy.
Fit with the Minervini Trend Template
Mark Minervini's Trend Template is a group of fixed technical rules made to filter for stocks in a clear Stage 2 uptrend. The idea is straightforward: trade in the direction of the strongest momentum. A look at PKE's chart and main measures shows it meets these important points:
- Trending Above Key Averages: The stock's present price rests well above its rising 50-day, 150-day, and 200-day simple moving averages (SMAs). This ordered position shows continued buying pressure across all major timeframes.
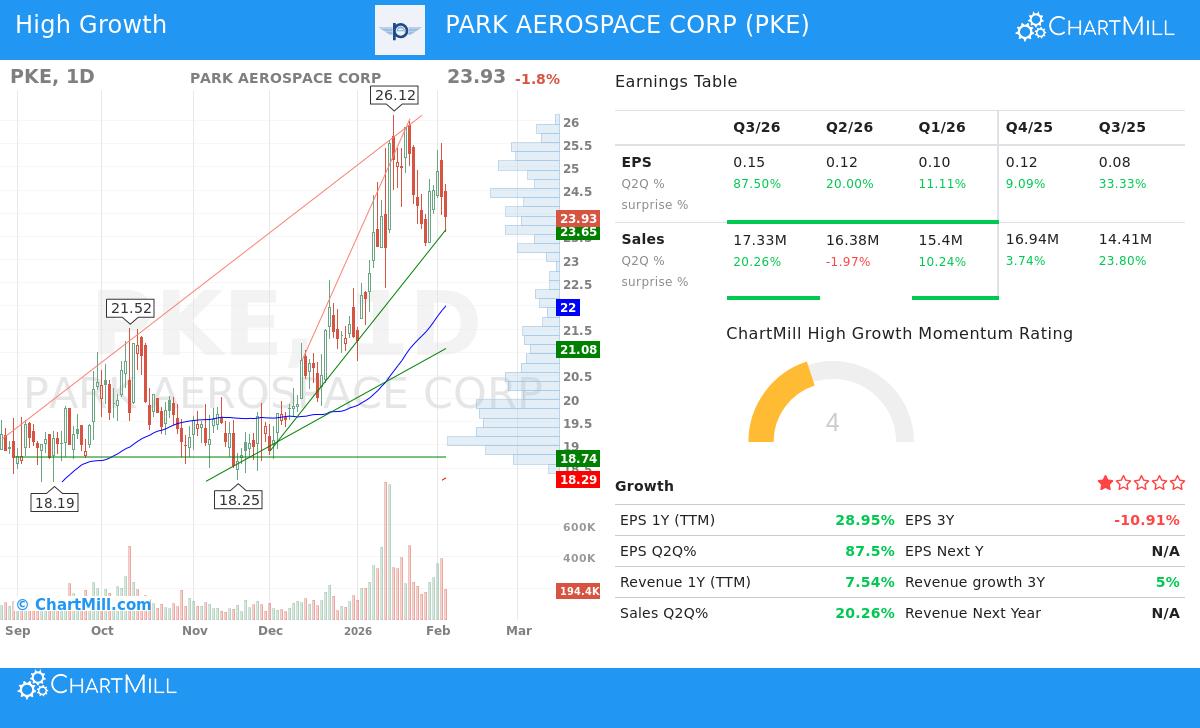
- Moving Average Order: The 50-day SMA ($22.00) is above both the 150-day SMA ($19.82) and the 200-day SMA ($18.29), while the 150-day SMA is also above the 200-day SMA. This "bullish order" is a standard sign of a sound, speeding uptrend.
- Nearness to Highs: PKE is trading within 25% of its 52-week high of $26.12, a main Minervini rule that centers on strength instead of low price. At the same time, the present price is more than 30% above its 52-week low, confirming a major recovery trend is already active.
- Better Relative Strength: With a ChartMill Relative Strength (CRS) score of 92.19, PKE is doing better than over 92% of the whole market. Minervini states that real market leaders regularly show high relative strength, as it points to institutional buying and sector leadership.
This technical view meets the central Minervini requirement: to only look at stocks that are already in a strong uptrend, thus improving the chances for the trader by following the main market direction.
Fundamentals for High-Growth Momentum
While the Trend Template makes sure a stock is technically good, the Minervini strategy highly values the "reason" behind the move. This is where high-growth momentum rules become important, looking for companies with speeding business results. PKE's recent fundamental data shows several good points:
- Earnings Speed Increase: The company is showing a clear pattern of speeding earnings growth on a quarterly basis. The latest quarter saw EPS rise 87.5% year-over-year, a major increase from the 20% growth noted in the previous quarter and the 11.1% growth the quarter before that. This sequential speed increase is a strong sign of getting better business conditions.
- Strong Annual Earnings Growth: On a trailing twelve-month (TTM) basis, earnings per share have grown by nearly 29%, pointing to solid basic profitability.
- Growing Profit Margins: Maybe one of the most attractive fundamental strengths is the steady growth of the company's profit margin. The last reported quarterly profit margin of 17.02% shows a clear gain from 14.68% the prior quarter and 7.36% two quarters before that. Rising margins suggest pricing ability, operational effectiveness, and scalable growth, all signs of a high-quality business.
- Firm Revenue Path: Top-line growth backs the bottom-line story. Quarterly sales growth was a solid 20.26% in the most recent period, and annual revenue growth stays positive.
For a growth investor, this mix of speeding earnings, growing margins, and firm sales growth gives the fundamental "support" that can maintain and explain a stock's technical breakout. It changes PKE from a simple chart pattern into a story of a company possibly reaching an operational turning point.
Technical Condition and Setup Summary
Beyond the specific Trend Template filters, a wider view of PKE's technical condition is very good. ChartMill's own Technical Rating gives the stock a top score of 10 out of 10, reflecting high marks across short-term and long-term trend measures, momentum, and relative performance. The long-term and short-term trends are both seen as positive.
The technical study also notes a good setup rating of 7, suggesting the stock is settling within its uptrend, which can give a possible entry point. The report finds a support area between $23.36 and $23.92, offering a reasonable zone for risk management. For a full breakdown of the support, resistance, and a sample trade setup, you can see the complete ChartMill Technical Analysis Report for PKE.
Conclusion
PARK AEROSPACE CORP shows a strong example of a stock that meets strict rules from both a technical and fundamental growth view. It demonstrates the Minervini method by showing a clear, multi-timeframe uptrend confirmed by better relative strength. Fundamentally, it adds to this technical strength with speeding earnings and quickly growing profit margins, main factors that high-growth momentum investors look for.
This link between a strong price trend and getting better business fundamentals is exactly what joined screening strategies try to find. It indicates PKE is not just moving with the market but may be on a course of continued leadership based on its own operational strengths.
Interested in finding more stocks that fit this mix of firm trends and high-growth momentum? You can look at the screening settings that found PKE and find other possible choices by going to the High Growth Momentum + Trend Template screen on ChartMill.
Disclaimer: This article is for informational and educational purposes only. It is not intended as investment advice, nor does it constitute a recommendation to buy, sell, or hold any security. The analysis is based on data provided and certain screening methods; investors should do their own complete research and consider their personal financial situation and risk tolerance before making any investment decisions. Past performance is not a guide to future results.