
For investors who use charts and price action to guide their choices, a methodical way to find possible trades is important. One method looks for stocks that are both technically sound and building a constructive price pattern, a pairing that can point to a possible breakout. This plan centers on two main proprietary metrics from ChartMill: the Technical Rating, which measures the general condition and trend of a stock, and the Setup Quality Rating, which judges if the stock's present price action offers a low-risk entry point. By sorting for stocks with high marks in both areas, traders try to find chances in market leaders that are resting before their next possible advance.
Polaris Inc. (NYSE:PII), a top designer and maker of power sports vehicles, motorcycles, and boats, now shows a profile that matches this breakout screening method. According to its latest technical analysis report, the stock displays the mix of basic strength and tactical placement that technical investors often look for.
Looking at the Technical Base
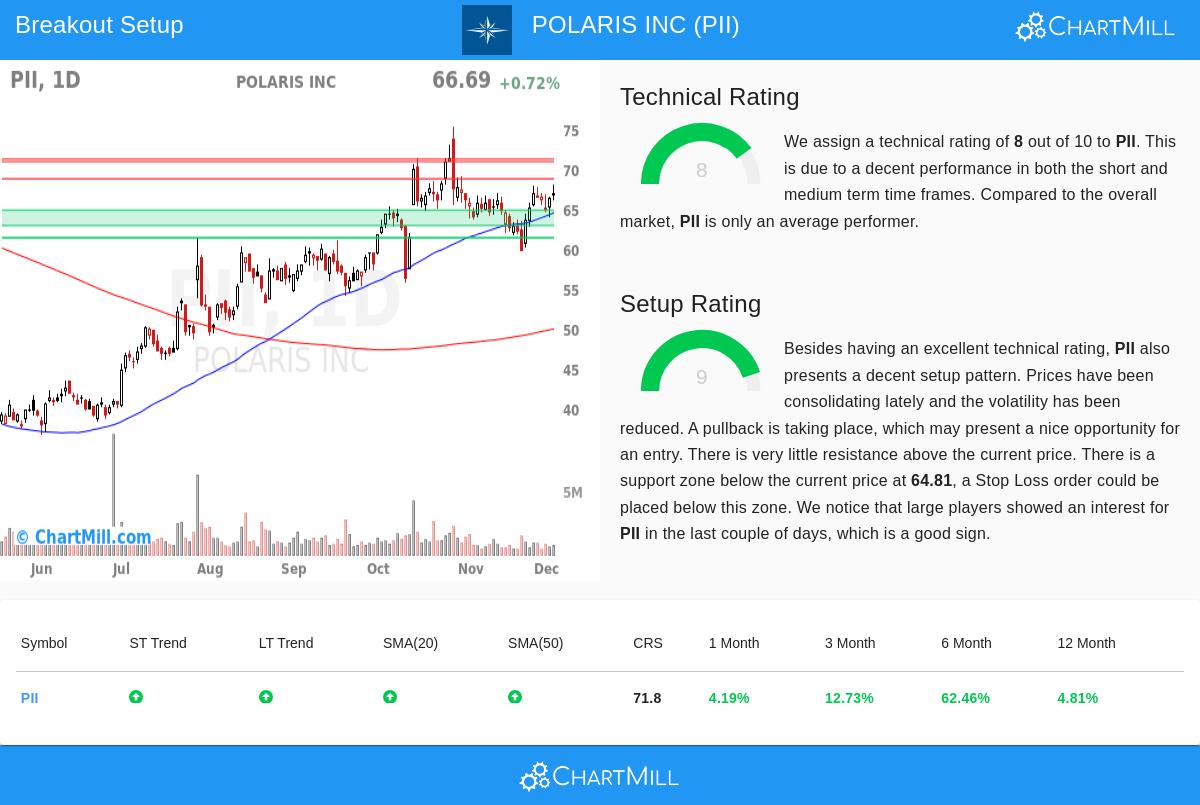
The heart of this plan first needs a stock to be in a confirmed uptrend, which is measured by ChartMill's Technical Rating. A high rating here implies the stock is a market leader with good momentum across several timeframes. For Polaris, the technical view is solid.
- Good Trend Agreement: The report states that both the long-term and short-term trends for PII are positive. This agreement across time periods is a main part of trend-following plans, showing continued buying pressure.
- Firm Relative Strength: In its industry, Polaris is a notable performer, doing better than 71% of its peers in the Leisure Products sector. This relative strength is an important filter for finding leaders instead of weaker stocks.
- Supportive Moving Averages: The stock is trading above its important moving averages (20, 50, 100, and 200-day), and all these averages are increasing. This ordered, positive alignment of moving averages works as a set of dynamic support levels, strengthening the positive trend formation.
This Technical Rating of 8 out of 10 verifies that PII is in a technically sound condition. A stock with such a rating is seen to be in an uptrend, meeting the "which stock" need of the plan by showing it has the basic momentum to possibly keep rising.
Judging the Setup Quality
A sound trend by itself is not a buy signal; entering a stock that has just completed a big, extended move can be risky. This is where the Setup Quality Rating becomes key, addressing the "when to buy" question. It searches for consolidation patterns where volatility lessens and the stock forms a base, giving a clear zone for setting risk. Polaris earns a high 9 in this group.
- Consolidation Inside a Range: Over the last month, PII has been trading between about $59.63 and $68.00. The report points out that prices have been consolidating with lower volatility, which is a typical feature of a stock pausing before its next possible rise.
- Clear Support and Resistance: The analysis finds definite technical levels. A major support area exists between $62.88 and $64.81, made by a mix of trendlines and moving averages. On the other hand, immediate overhead resistance is seen near $68.71. This makes a well-set range for planning a trade.
- Nearness to Breakout: The stock is now trading close to the top of its recent range. The setup indicates a possible buy signal on a move above the $68.72 resistance level, which would confirm a breakout from the consolidation pattern.
The high Setup Rating shows that PII is not stretched but is instead tightening in a close pattern. This offers a tactical chance where a trader can set a logical stop-loss order just below the noted support area, thus setting and limiting possible risk on the trade.
A Possible Technical Situation
The combination of a sound technical base and a high-quality setup forms the idea for a breakout play. The automated analysis indicates a situation where an entry is started above resistance at $68.72, with a stop-loss set below the support area at $62.87. This would mean a trade with a set risk of about 8.5%. The existence of little resistance above the present price could permit a clear upward path if the breakout works.
It is important to remember this is a purely technical view based on price patterns and indicators. Traders should always think about wider market conditions, now, the S&P 500 shows positive long and short-term trends, which can give a supportive setting for such breakout setups. Also, individual company news, coming earnings reports, or sector-specific events should be included in any final choice.
Interested in finding more stocks that meet these technical and setup needs? You can use the same breakout screen with the Technical Breakout Setups tool.
Disclaimer: This article is for information only and does not make up investment advice, a recommendation, or an offer or solicitation to buy or sell any securities. The analysis shown is based on technical metrics and automated reports. All investing and trading includes risk, including the possible loss of principal. Readers should do their own research and talk with a qualified financial professional before making any investment decisions. Past results are not a guide for future outcomes.