
Investors looking to find high-potential stocks with strong growth traits often use systematic methods that combine strict technical and fundamental analysis. One well-known method is the strategy made popular by Mark Minervini, a two-time U.S. Investing Champion. His method, called Specific Entry Point Analysis (SEPA), centers on finding stocks that are already in clear uptrends and have improving business fundamentals. The aim is to locate market leaders early in their major price increases while using firm risk management rules to guard capital. A central part of this strategy is the Minervini Trend Template, a group of technical standards meant to filter for stocks showing clear, multi-timeframe strength.
PHATHOM PHARMACEUTICALS INC (NASDAQ:PHAT) presents an interesting case for investors using this growth-oriented, trend-following structure. The clinical-stage biopharmaceutical company, which focuses on new treatments for gastrointestinal diseases, now shows a technical and fundamental picture that matches several key parts of the Minervini strategy.
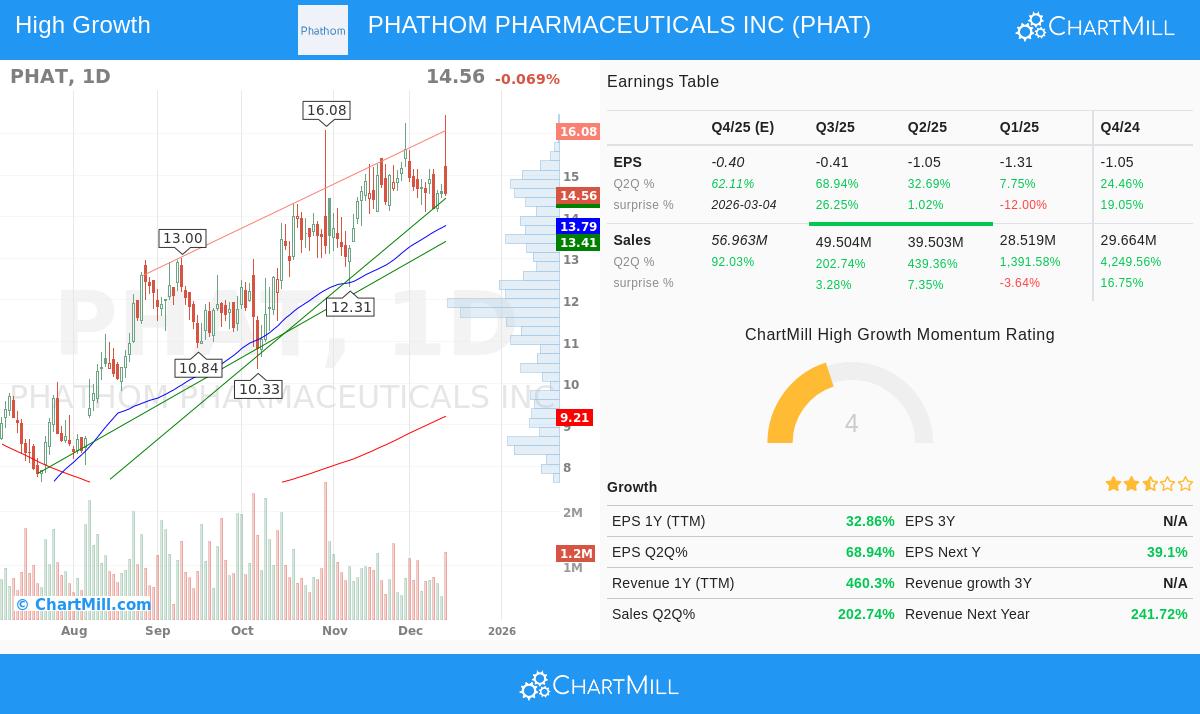
Technical Strength: Matching the Trend Template
The Minervini Trend Template is based on exact moving average arrangements and price action compared to important highs and lows. Its goal is to clearly find stocks that are not only going up, but are in clear, continuing uptrends with notable institutional backing. A look at PHAT's chart shows it meets these important technical marks.
- Moving Average Arrangement: The stock's price is trading above all its main simple moving averages (SMAs), the 50-day ($13.79), 150-day ($10.70), and 200-day ($9.21). Also, the 50-day SMA is above the 150-day SMA, which is above the 200-day SMA. This "stacked" order, with shorter-term averages above longer-term ones, is a standard sign of a clear, multi-layered uptrend.
- Trend Direction: Both the 150-day and 200-day moving averages have a clear positive slope, confirming the long-term trend is rising. This meets the Trend Template's need for continued momentum.
- Nearness to Highs: A key part of Minervini's thinking is to concentrate on strength, not weakness. PHAT's current price is within 12% of its 52-week high of $16.45, showing it is behaving like a market leader instead of a laggard. At the same time, the price is about 560% above its 52-week low, meaning a strong recovery and trend shift has already happened.
- Strong Relative Strength: Maybe most significant is PHAT's ChartMill Relative Strength (CRS) score of 93.5. This means the stock is doing better than over 93% of the whole market. Minervini notes that the largest winners usually have high relative strength rankings (ideally above 80) before their major breakouts, as it shows they are being bought by institutional investors before the wider market.
Fundamental Momentum: The Driver for Strong Growth
While the Trend Template makes sure a stock is technically sound, the Minervini strategy gives similar weight to improving business speed. The "High Growth Momentum" part of the screen that found PHAT looks for companies showing major gains in sales and earnings, which often act as the reason for continued price gains.
PHAT's fundamental data shows several strong growth measures:
- Revenue Fast Growth: The company is in the middle of a major commercial launch. Year-over-year revenue growth is notable, with the most recent quarter showing a gain of over 202%. Even more striking is the trailing twelve-month (TTM) revenue growth of over 460%. This kind of top-line surge is just what growth investors and methods like SEPA search for, as it points to successful market entry and expansion.
- Earnings Path: As a commercial-stage biotech, PHAT is naturally not yet profitable on a net income basis. However, the direction in earnings per share (EPS) is clearly getting better. The EPS growth for the last quarter compared to the same quarter a year ago was about 69%. This major shrinking of losses quarter-over-quarter is a positive change that often comes before a move to profitability.
- Analyst Belief: The market's forward-looking expectations are also increasing. Analyst estimates for PHAT's next-year EPS have been moved higher by over 6% in the last three months. Such upward changes are a key part of the Minervini strategy, as they mirror growing professional belief in the company's future earnings ability and can lead to more buying activity.
Technical Condition and Setup Evaluation
Beyond the exact Trend Template standards, a wider view of PHAT's technical condition is positive. ChartMill's own Technical Rating for the stock is a solid 8 out of 10, meaning very good long-term and short-term trends. The report states the stock is doing better than 82% of its peers in the Pharmaceuticals industry and is trading near new 52-week highs, both fitting the picture of a market leader.
The analysis does mention that while the technical rating is very good, the shorter-term Setup Quality rating is now medium. This indicates the stock has been moving in a range between about $14.07 and $16.45 over the past month after its strong rise. For a trend-follower, such a period of movement is not always bad; it can offer a formed base from which the next part of the trend may begin. Investors would watch this period for a possible volatility contraction pattern (VCP) or a high-volume move above the recent range as a possible entry point, always together with careful stop-loss use as required by the full Minervini strategy.
For a full look at support, resistance levels, and more technical notes, you can see the complete ChartMill Technical Report for PHAT.
Conclusion
PHATHOM PHARMACEUTICALS INC shows the kind of security that systematic growth and momentum screens are made to find. It has the technical background required by the Minervini Trend Template, a definite, multi-timeframe uptrend with strong relative strength. Fundamentally, it is showing the kind of fast revenue growth and bettering earnings path that can act as a strong reason for continued stock results. While the current period of movement suggests a need for watchfulness regarding a best entry point, the mix of these factors makes PHAT a stock worth adding to the watchlists of investors focused on high-growth, trend-following methods.
Interested in finding more stocks that match this high-growth, trending picture? You can use the same "High Growth Momentum + Trend Template" screen that found PHAT yourself using this link: Discover More High-Growth Trend Candidates.
Disclaimer: This article is for informational and educational purposes only. It is not intended as investment advice, a recommendation, or an offer to buy or sell any security. The analysis is based on data believed to be reliable, but its accuracy cannot be guaranteed. Investing involves risk, including the potential loss of principal. You should conduct your own research and consult with a qualified financial advisor before making any investment decisions.