
A methodical process for finding growth stocks with high potential joins detailed chart study with basic momentum filters. The system brings together Mark Minervini's Trend Template, which sorts for stocks showing solid uptrend features, with a High Growth Momentum score that finds companies with improving basic performance. This two-part process looks for investments that not only show good price formations but also have a foundation of business progress that may support further price gains.
Technical Strength and Trend Agreement
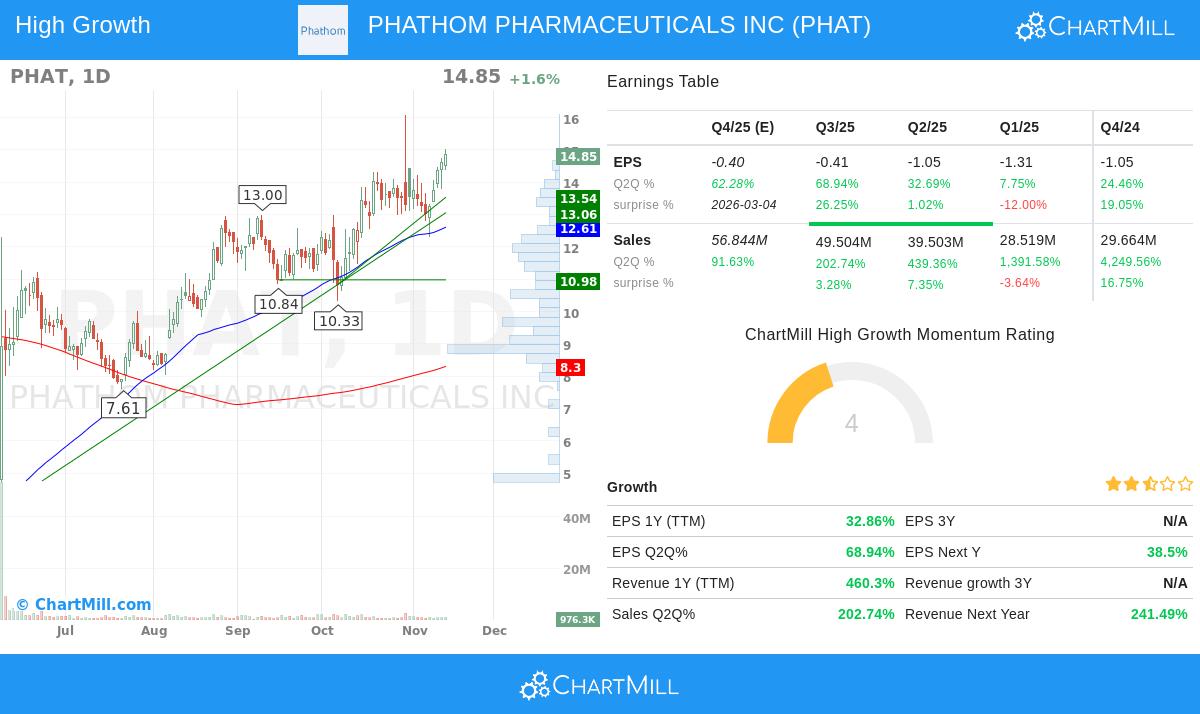
PHATHOM PHARMACEUTICALS INC (NASDAQ:PHAT) shows notable technical features that match Minervini's Trend Template rules. The stock now trades higher than all main moving averages, with its price of $14.85 sitting well above the 50-day SMA ($12.61), 150-day SMA ($9.23), and 200-day SMA ($8.30). Also, these moving averages are ordered in a correct bullish pattern, with the shorter-term averages higher than the longer-term ones, confirming the stock is in a clear Stage 2 uptrend.
The stock's location compared to its 52-week range adds to its technical standing. Now trading at $14.85, PHAT sits about 78% higher than its 52-week low of $2.21 while staying within 8% of its 52-week high of $16.08. This location meets the Trend Template rule that stocks trade at least 30% higher than their 52-week lows while remaining within 25% of their highs, showing steady momentum without being too stretched.
Notable Relative Strength and Market Position
PHAT shows very good relative strength with a ChartMill Relative Strength reading of 93.79, meaning it does better than almost 94% of all stocks. This high relative strength is a key part of the Minervini method, as market leaders often show better price action before their biggest gains. In the pharmaceuticals field, PHAT does better than 87% of its 191 industry competitors, indicating company-specific reasons are pushing its results beyond industry movements.
The stock's momentum is also shown by its strong results across different periods:
- 263.5% gain over the past six months
- 69.1% appreciation over the past twelve months
- 45.0% advance in the most recent quarter
These results are much better than the wider market, highlighting the stock's leader status that Minervini notes as important for finding possible high performers.
Basic Momentum Catalysts
Besides chart analysis, PHAT shows strong basic growth that makes it suitable for high growth momentum investing. The company's revenue growth has been remarkable, with trailing twelve-month revenue increasing 460% year-over-year. Recent quarterly results show even faster growth, with the last quarter having 202.7% sales growth compared to the same quarter last year.
The earnings path shows clear betterment, with EPS growth of 68.9% in the most recent quarter. Analyst views have become more favorable, with increases to both earnings and revenue projections for the next year. This mix of solid current results and improving future projections creates a positive basic situation that may support continued price gains.
Risk Management Points
While the chart and basic view seems notable, correct risk management is still important. The stock has set several support levels, with the closest support area between $13.54 and $13.79. This zone brings together several technical elements including moving averages and trendlines, giving a reasonable level for initial stop-loss orders. The stock's average daily trading volume of about 1.15 million shares gives enough liquidity for trade entry and exit.
Technical Review Summary
According to ChartMill's detailed technical review, PHAT gets a solid technical score of 9 out of 10, showing its steady results across both short and long-term periods. The review states that "prices have been consolidating lately and the volatility has been reduced," with less resistance above present levels. Large investors have shown more activity in recent days, possibly meaning institutional buying. The full technical report gives a close look at support and resistance levels, volume formations, and specific trade setup details.
View the complete technical analysis for PHAT
Finding Other Opportunities
For investors looking for more choices that fit similar chart and basic rules, the High Growth Momentum + Trend Template filter methodically finds stocks showing both good price formations and speeding up company basics. This filtering method can help investors find other possible leaders before they are known by the wider market.
Find more High Growth Momentum stocks meeting the Trend Template criteria
Disclaimer: This review is for information and learning only and should not be taken as investment guidance. The information given does not suggest any specific security or action. Investors should do their own study and talk with a qualified financial advisor before making any investment choices. Past results do not guarantee future outcomes, and all investments have risk, including the potential loss of initial investment.