
Investors looking to find high-potential stocks frequently use systematic methods that mix strict technical and fundamental study. One well-known method is the plan created by Mark Minervini, a two-time U.S. Investing Champion. His method, contained in the Specific Entry Point Analysis (SEPA) system, aims to locate stocks with strong growth possibility by confirming they are in solid uptrends and have good, improving business foundations. An important first step in this process is the Minervini Trend Template, a group of technical rules meant to find stocks in clear Stage 2 uptrends. To better narrow the search for real market leaders, this technical base can be joined with a search for strong growth momentum, which looks for companies with better earnings and sales improvement. Peapack-Gladstone Financial Corp. (NASDAQ:PGC) recently appeared from a screen made on these joined ideas, needing a more detailed examination.
Looking at the Technical Base: The Trend Template
The Minervini Trend Template is not just an idea but a fixed list. Its goal is to remove all stocks not showing a clear, multi-timeframe uptrend, which creates discipline and limits focus only to the best technical patterns. For a stock like PGC, meeting this template is the first important step.
A look at the main rules against the given data shows a positive technical view:
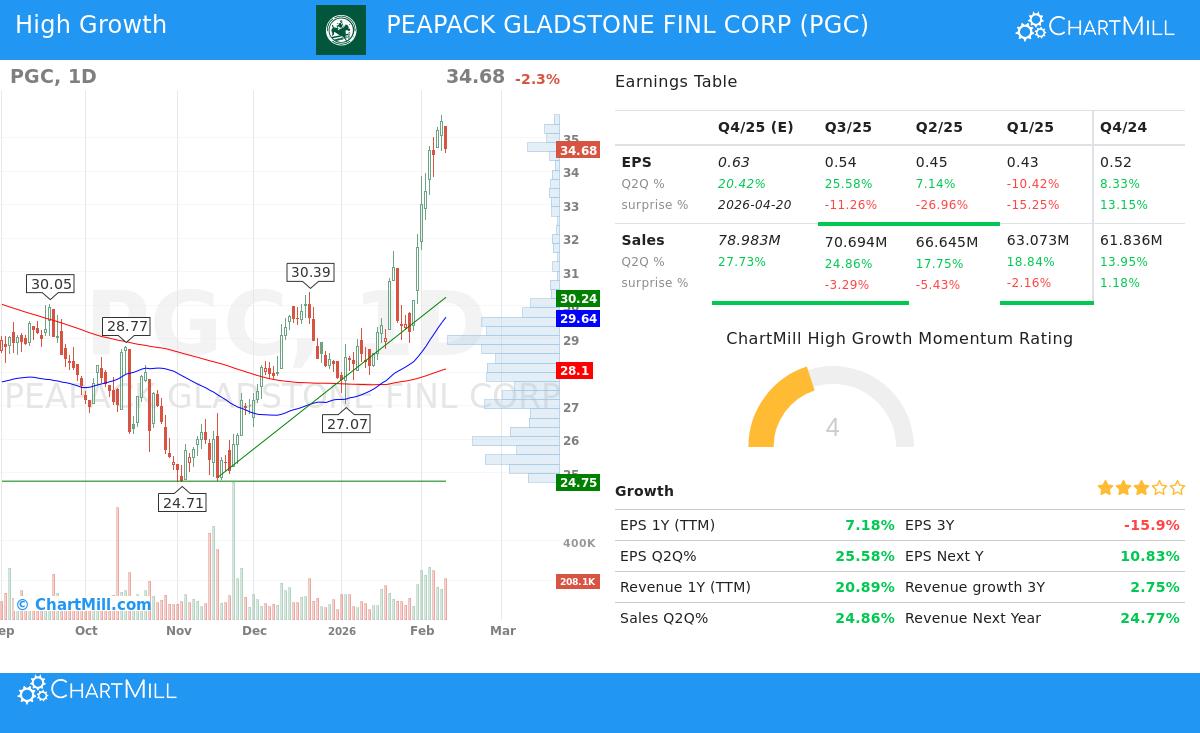
- Price vs. Moving Averages: The present price of $34.68 trades much higher than its important moving averages, the 50-day ($29.64), 150-day ($28.10), and 200-day ($28.10). This order is a basic need, showing continued buying across short, medium, and long-term periods.
- Trending Averages: Importantly, these moving averages are not flat but are all increasing. The 200-day SMA, a measure for the long-term trend, has gone up from 28.06 to 28.10, confirming a good long-term path. This upward move across averages shows steady institutional buying.
- Moving Average Order: The 50-day SMA sits above both the 150-day and 200-day SMAs, and the 150-day SMA is above the 200-day SMA. This "stacked" order is a standard sign of a solid, steady uptrend where shorter-term movement leads longer-term direction.
- Nearness to Highs: PGC's price is within 2.8% of its 52-week high of $35.68, easily within the template's rule of being within 25% of the high. At the same time, the price is about 45% above its 52-week low, passing the 30% limit. This mix shows the stock is displaying strength, not bouncing back from serious lows.
- Relative Strength: With a ChartMill Relative Strength (CRS) ranking of 75.81, PGC is doing better than about three-fourths of the market. While Minervini often wants scores above 80 for real leadership, a score above 70 meets the template's minimum and indicates the stock is maintaining its position, especially as it tests new highs.
This technical shape is seen in the stock's ChartMill Technical Rating of 8 out of 10, which says both short and long-term trends are good and the stock is trading close to its 52-week high. The template's strictness makes sure an investor is only studying stocks that are already in a clear uptrend, thus moving with the market's momentum instead of trying to guess a change.
Studying the Growth Driver: High Growth Momentum
Meeting the Trend Template deals with the "when" by confirming the trend. The "why" is dealt with by fundamental growth. Minervini's study shows that the largest stock market winners are nearly always backed by strong earnings and sales growth. The High Growth Momentum (HGM) rating tries to measure this by studying the improvement and quality of a company's financial results.
For PGC, several data points highlight its growth story:
- Earnings Improvement: The latest quarterly EPS growth year-over-year is a solid 25.58%, a clear improvement from the last quarter's growth of 7.14% and the quarter before that, which showed a drop. This pattern of getting better quarterly growth is a key good sign.
- Sales Movement: Revenue growth is also solid, with the last quarter showing a 24.86% rise year-over-year. This comes after good growth in earlier quarters (23.22% and 21.26%), showing continued top-line growth.
- Profit Margin Comeback: After a time of shrinking, the profit margin in the last reported quarter got better to 13.62%, up from 11.39% in the prior quarter. A growing margin on increasing sales is a strong mix that can push fast earnings growth.
- Forward Estimates: Analyst guesses for the next quarter predict continued growth, with EPS expected to rise 20.42% and sales 27.73%. While longer-term EPS guesses have seen some lowering, the near-term view stays positive.
These basics suggest the company is in a time of operational betterment and growth. For a growth investor, this mix of improving earnings, solid sales growth, and margin comeback is exactly the kind of fundamental "engine" that can push a stock already in a technical uptrend to more highs. It gives the logical reason for the price strength found by the Trend Template.
Technical Report Summary and Present Pattern
The given Technical Analysis Report for PGC gives a short summary. It confirms the stock's high technical rating of 8, pushed by good trends across timeframes and action near 52-week highs. The report finds clear support areas, mainly around $30.33 (from joined trendlines and moving averages) and $26.46, which would be important levels to see on any drop. Resistance is noted in the $35.24-$35.51 area, which the stock is now testing.
An important note from the report is on the Setup Rating, which is now a 3. The study says that while the technical state is very good, "price movement has been a little bit too volatile to find a nice entry and exit point." This is a key part of the Minervini method: finding a strong stock is only the first step. The next is waiting for a low-risk, high-chance entry point, often through a volatility contraction pattern (VCP). The present study suggests PGC may be stretched in the short term and waiting for a better pause before giving a good entry.
Final Thoughts
Peapack-Gladstone Financial Corp. shows an example in how joined screening tools can highlight possible chances. It shows clear agreement with the Minervini Trend Template, displaying the multi-layered uptrend and relative strength needed by the plan. Basically, it shows signs of high growth momentum with improving quarterly earnings and sales. However, the present technical study suggests waiting could be needed, as the stock must form a more helpful pattern for best risk/reward entry.
For investors wanting to find other choices that meet this mix of strict technical trend and fundamental growth movement, more study can be done using the set screen: High Growth Momentum + Trend Template.
Disclaimer: This article is for information and learning only. It is not a suggestion to buy or sell any security. The study is based on given data and a particular investment method. All investing has risk, including the possible loss of principal. You should do your own study and talk with a qualified financial advisor before making any investment choices.