
For investors who use charts and price action to guide their choices, a methodical way to find opportunities is important. One technique involves searching the market for stocks that are both technically sound and creating a consolidation pattern, indicating a possible breakout is near. This method depends on two main ideas: first, finding stocks in a verified uptrend, and second, finding the best time to enter that trend as it continues. A stock that is moving upward with force but has paused often offers a good risk-reward arrangement for technical traders.
PEPSICO INC (NASDAQ:PEP) is currently found by such a scan, displaying traits that may interest investors using this breakout method. The consumer staples company, with its collection of brands like Lay's, Gatorade, and Pepsi-Cola, is showing a positive technical position as it trades close to the top of its recent range.
Reviewing the Technical Base
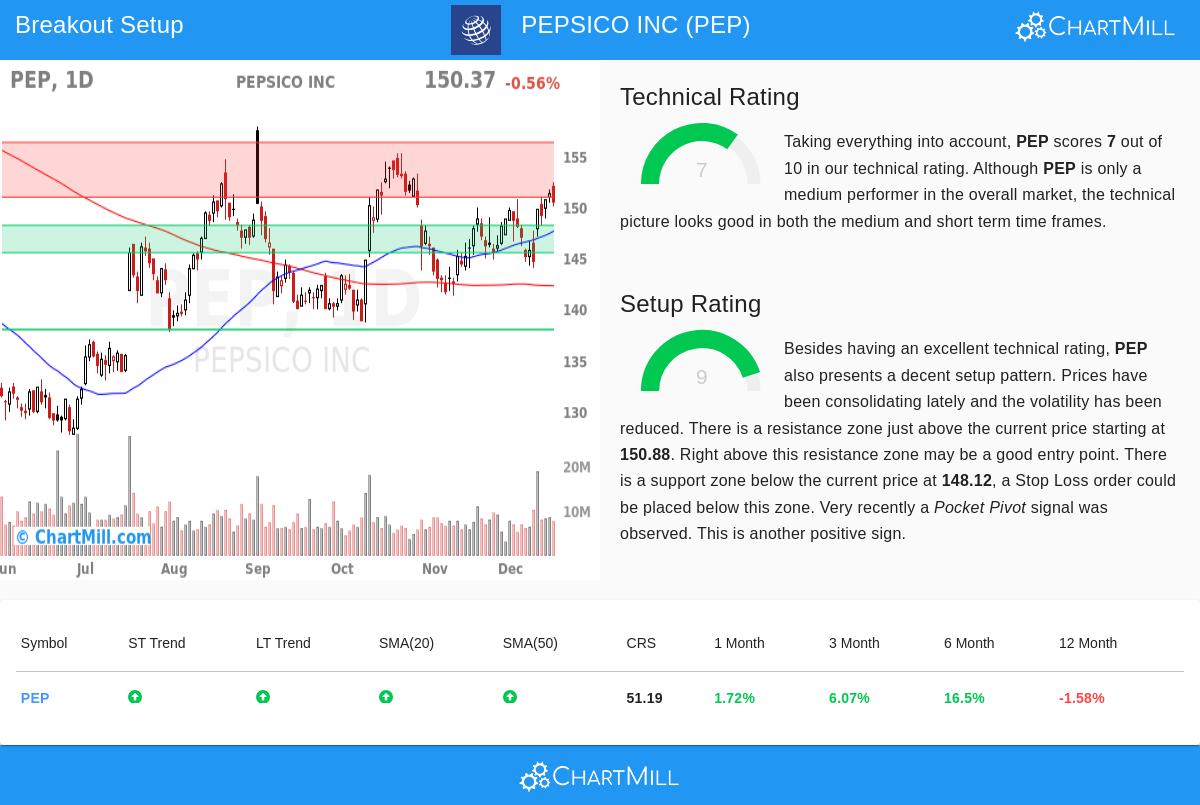
The first part of this method is confirming the stock is in a good uptrend, as a firm existing trend raises the chance that a breakout will result in more gains. According to the ChartMill Technical Analysis report, PepsiCo receives a Technical Rating of 7 out of 10, signaling a firm technical background.
The report points out several good elements that add to this score:
- Both the near-term and longer-term trends for PEP are scored as good, a positive alignment for continued upward price movement.
- The stock is trading above important moving averages, including the 20-day, 50-day, and 100-day Simple Moving Averages (SMAs), which are all moving upward. This indicates continued buying interest across different time periods.
- While PEP is trading in the higher part of its 52-week range, the report mentions it is somewhat behind the wider S&P 500, which is trading close to new highs. This relative performance is neither positive nor negative but indicates there could be space for improvement if the stock can move past its current resistance.
This technical rating is important because it selects for stocks with momentum. A breakout from a stock already in a downtrend or a flat pattern involves more risk. PEP's confirmed positive trends offer a supportive condition for any possible move higher.
Judging the Setup Condition
The second, and just as important, part is the condition of the consolidation pattern. A stock can be in a good trend but be too far along to buy, giving a bad entry point. This is where the Setup Quality Rating becomes key, as it finds times of tightening price action and lower volatility that frequently come before a new upward move. PepsiCo gets a very high Setup Rating of 9 out of 10.
The technical report explains why the setup looks positive:
- The stock has been trading in a narrow consolidation range over the last month, between about $143.91 and $152.35. This coiling movement often gathers energy for a directional move.
- A clear support area has been formed between $145.45 and $148.12, created by a mix of trendlines and moving averages. This gives a logical area below the current price to set a protective stop-loss order.
- A defined resistance area is located just above, between $150.88 and $156.25. A clear move above this area could mark the beginning of the next positive phase.
- A recent "Pocket Pivot" signal was seen, which is a price and volume pattern indicating buying by larger investors, adding a good note to the setup.
This high setup score is the central piece of the method. It answers the "when" to buy, indicating the stock is not overbought but is instead forming a base. The narrow range gives clear points for both entry (a move above resistance) and risk control (a stop below support).
Trade Plan and Market Environment
Based on this review, the report proposes a possible trading plan. An entry could be thought about on a breakout above the recent high near $152.36, with an initial stop-loss order set below the support area around $145.44. This would mean a risk of about 4.5% on the trade itself.
It is important to note that while PEP shows a good near-term trend, the wider S&P 500's longer-term trend is currently neither positive nor negative, though its near-term trend is good. This mixed market environment highlights the need for careful risk control on any single position, as sector changes and broader economic shifts can always affect performance.
Locating Comparable Chances
PepsiCo is one instance of a stock currently fitting the requirements for a technical breakout setup. Investors looking to search for comparable chances in real-time can use the dedicated Technical Breakout Setups screen. This tool methodically sorts the market for stocks with high technical and setup ratings, giving a daily list of possible candidates for more review.
Disclaimer: This article is for informational purposes only and does not constitute investment advice, a recommendation, or an offer to buy or sell any security. The review is based on technical data and automated scoring models. All investing involves risk, including the possible loss of principal. Past performance is not indicative of future results. Always conduct your own due diligence, consider your financial situation and risk tolerance, and consult with a qualified financial advisor before making any investment decisions. The described trade setup is automatically generated and should not be interpreted as a specific recommendation.