
In this article we will dive into PDD HOLDINGS INC (NASDAQ:PDD) as a possible candidate for growth investing. Investors should always do their own research, but we noticed PDD HOLDINGS INC showing up in our strong growth, ready to breakout screen, which makes it worth to investigate a bit more.
A Closer Look at Growth for PDD
To evaluate a stock's growth potential, ChartMill utilizes a Growth Rating on a scale of 0 to 10. This comprehensive assessment considers various growth aspects, including historical and estimated EPS and revenue growth. PDD has achieved a 8 out of 10:
- PDD shows a strong growth in Earnings Per Share. In the last year, the EPS has been growing by 78.54%, which is quite impressive.
- Measured over the past years, PDD shows a very strong growth in Earnings Per Share. The EPS has been growing by 106.51% on average per year.
- The Revenue has grown by 59.04% in the past year. This is a very strong growth!
- The Revenue has been growing by 67.20% on average over the past years. This is a very strong growth!
- Based on estimates for the next years, PDD will show a quite strong growth in Revenue. The Revenue will grow by 13.52% on average per year.
A Closer Look at Health for PDD
A critical element of ChartMill's stock evaluation is the Health Rating, which spans from 0 to 10. This rating considers multiple health factors, including liquidity and solvency, both in absolute terms and relative to industry peers. PDD has received a 9 out of 10:
- PDD has an Altman-Z score of 6.08. This indicates that PDD is financially healthy and has little risk of bankruptcy at the moment.
- With an excellent Altman-Z score value of 6.08, PDD belongs to the best of the industry, outperforming 87.10% of the companies in the same industry.
- There is no outstanding debt for PDD. This means it has a Debt/Equity and Debt/FCF ratio of 0 and it is amongst the best of the sector and industry.
- PDD has a Current Ratio of 2.21. This indicates that PDD is financially healthy and has no problem in meeting its short term obligations.
- With an excellent Current ratio value of 2.21, PDD belongs to the best of the industry, outperforming 80.65% of the companies in the same industry.
- A Quick Ratio of 2.21 indicates that PDD has no problem at all paying its short term obligations.
- Looking at the Quick ratio, with a value of 2.21, PDD belongs to the top of the industry, outperforming 93.55% of the companies in the same industry.
Exploring PDD's Profitability
ChartMill assigns a proprietary Profitability Rating to each stock. The score is computed by evaluating various profitability ratios and margins and ranges from 0 to 10. PDD was assigned a score of 8 for profitability:
- PDD has a Return On Assets of 22.26%. This is amongst the best in the industry. PDD outperforms 96.77% of its industry peers.
- Looking at the Return On Equity, with a value of 35.89%, PDD belongs to the top of the industry, outperforming 90.32% of the companies in the same industry.
- PDD has a Return On Invested Capital of 28.81%. This is amongst the best in the industry. PDD outperforms 96.77% of its industry peers.
- Measured over the past 3 years, the Average Return On Invested Capital for PDD is significantly above the industry average of 11.79%.
- The 3 year average ROIC (25.13%) for PDD is below the current ROIC(28.81%), indicating increased profibility in the last year.
- PDD has a better Profit Margin (28.55%) than 100.00% of its industry peers.
- In the last couple of years the Profit Margin of PDD has grown nicely.
- Looking at the Operating Margin, with a value of 27.53%, PDD belongs to the top of the industry, outperforming 100.00% of the companies in the same industry.
- In the last couple of years the Operating Margin of PDD has grown nicely.
- PDD's Gross Margin of 60.92% is amongst the best of the industry. PDD outperforms 83.87% of its industry peers.
Why is PDD a setup?
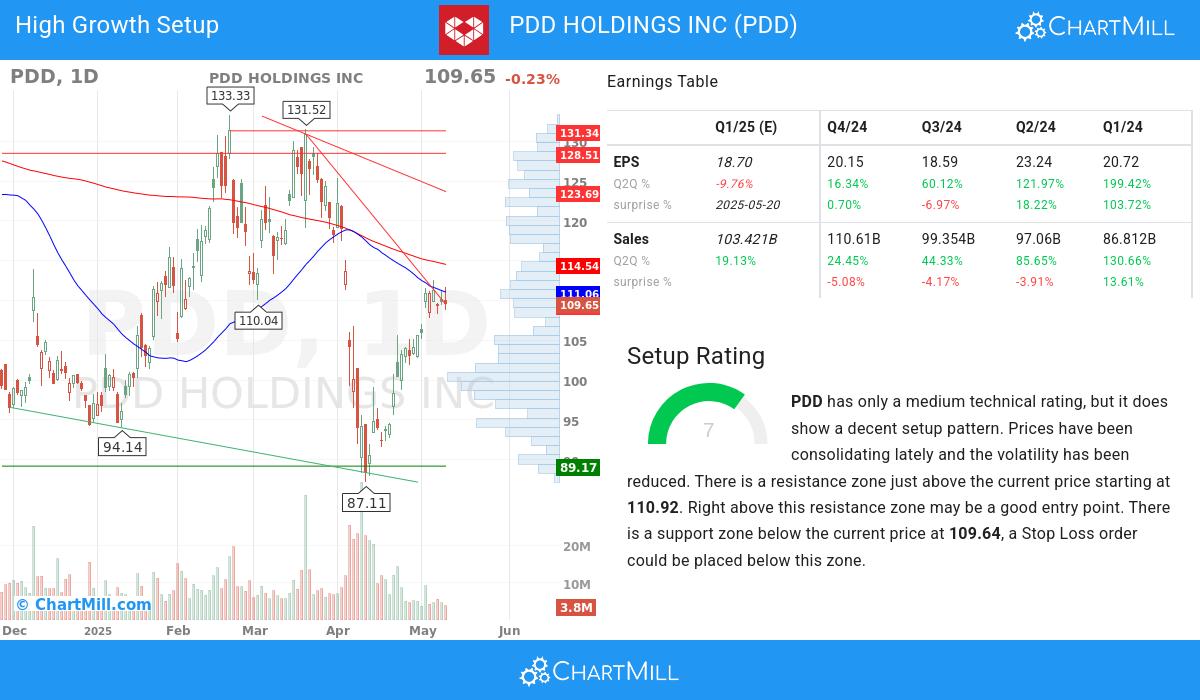
ChartMill also assigns a Setup Rating to each stock. This rating, on a scale of 0 to 10, reflects the degree of consolidation observed based on short-term technical indicators. Currently, PDD exhibits a 7 setup rating, indicating its consolidation status in recent days and weeks.
PDD has only a medium technical rating, but it does show a decent setup pattern. Prices have been consolidating lately and the volatility has been reduced. There is a resistance zone just above the current price starting at 110.92. Right above this resistance zone may be a good entry point. There is a support zone below the current price at 109.64, a Stop Loss order could be placed below this zone.
Every day, new Strong Growth stocks can be found on ChartMill in our Strong Growth screener.
Check the latest full fundamental report of PDD for a complete fundamental analysis.
For an up to date full technical analysis you can check the technical report of PDD
Keep in mind
This article should in no way be interpreted as advice. The article is based on the observed metrics at the time of writing, but you should always make your own analysis and trade or invest at your own responsibility.