
Consider OSHKOSH CORP (NYSE:OSK) as a top pick for dividend investors, identified by our stock screening tool. NYSE:OSK shines in terms of profitability, solvency, and liquidity, all while paying a decent dividend. Let's dive deeper into the analysis.
Looking at the Dividend
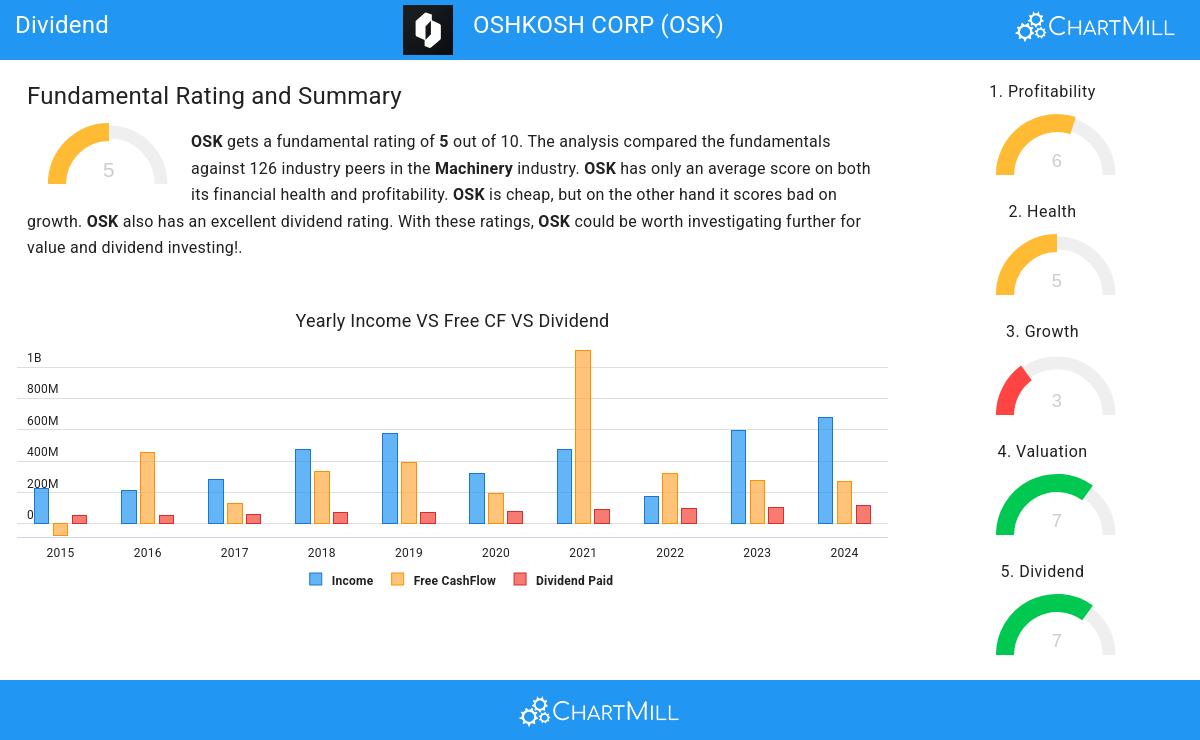
To gauge a stock's dividend quality, ChartMill utilizes a Dividend Rating ranging from 0 to 10. This comprehensive assessment considers various dividend aspects, including yield, history, growth, and sustainability. NYSE:OSK has achieved a 7 out of 10:
- Compared to an average industry Dividend Yield of 1.77, OSK pays a better dividend. On top of this OSK pays more dividend than 86.51% of the companies listed in the same industry.
- On average, the dividend of OSK grows each year by 11.40%, which is quite nice.
- OSK has paid a dividend for at least 10 years, which is a reliable track record.
- OSK has not decreased their dividend for at least 10 years, which is a reliable track record.
- 17.61% of the earnings are spent on dividend by OSK. This is a low number and sustainable payout ratio.
ChartMill's Evaluation of Health
ChartMill assigns a proprietary Health Rating to each stock. The score is computed by evaluating various liquidity and solvency ratios and ranges from 0 to 10. NYSE:OSK was assigned a score of 5 for health:
- An Altman-Z score of 3.10 indicates that OSK is not in any danger for bankruptcy at the moment.
- OSK has a debt to FCF ratio of 3.57. This is a good value and a sign of high solvency as OSK would need 3.57 years to pay back of all of its debts.
- With a decent Debt to FCF ratio value of 3.57, OSK is doing good in the industry, outperforming 62.70% of the companies in the same industry.
- OSK has a Debt/Equity ratio of 0.14. This is a healthy value indicating a solid balance between debt and equity.
- OSK has a Debt to Equity ratio of 0.14. This is in the better half of the industry: OSK outperforms 74.60% of its industry peers.
Analyzing Profitability Metrics
ChartMill employs its own Profitability Rating system for stock evaluation. This score, ranging from 0 to 10, is derived from an analysis of diverse profitability metrics and margins. In the case of NYSE:OSK, the assigned 6 is noteworthy for profitability:
- OSK has a Return On Assets of 7.23%. This is in the better half of the industry: OSK outperforms 66.67% of its industry peers.
- With a decent Return On Equity value of 16.41%, OSK is doing good in the industry, outperforming 73.81% of the companies in the same industry.
- OSK's Return On Invested Capital of 13.40% is fine compared to the rest of the industry. OSK outperforms 79.37% of its industry peers.
- The last Return On Invested Capital (13.40%) for OSK is above the 3 year average (10.13%), which is a sign of increasing profitability.
- OSK's Operating Margin has improved in the last couple of years.
More Best Dividend stocks can be found in our Best Dividend screener.
Our latest full fundamental report of OSK contains the most current fundamental analsysis.
Disclaimer
This article should in no way be interpreted as advice. The article is based on the observed metrics at the time of writing, but you should always make your own analysis and trade or invest at your own responsibility.
