
For investors looking to join solid fundamental momentum with positive technical patterns, a multi-factor screening method can be an effective instrument. One such technique focuses on finding stocks that at the same time display high growth momentum, sound technical condition, and a positive chart formation. This tactic tries to locate firms not just increasing their earnings at a quickening rate but also trading in a way that points to institutional buying and a possible move upward from a period of sideways movement. The aim is to match the fundamental reasons for price gains with the technical timing for a purchase.
OR Royalties Inc (NYSE:OR) appears as a candidate that fits these joined conditions. The firm, which buys and oversees a collection of precious metal royalties and streams, has shown notable fundamental momentum while its stock chart displays a technically solid formation.
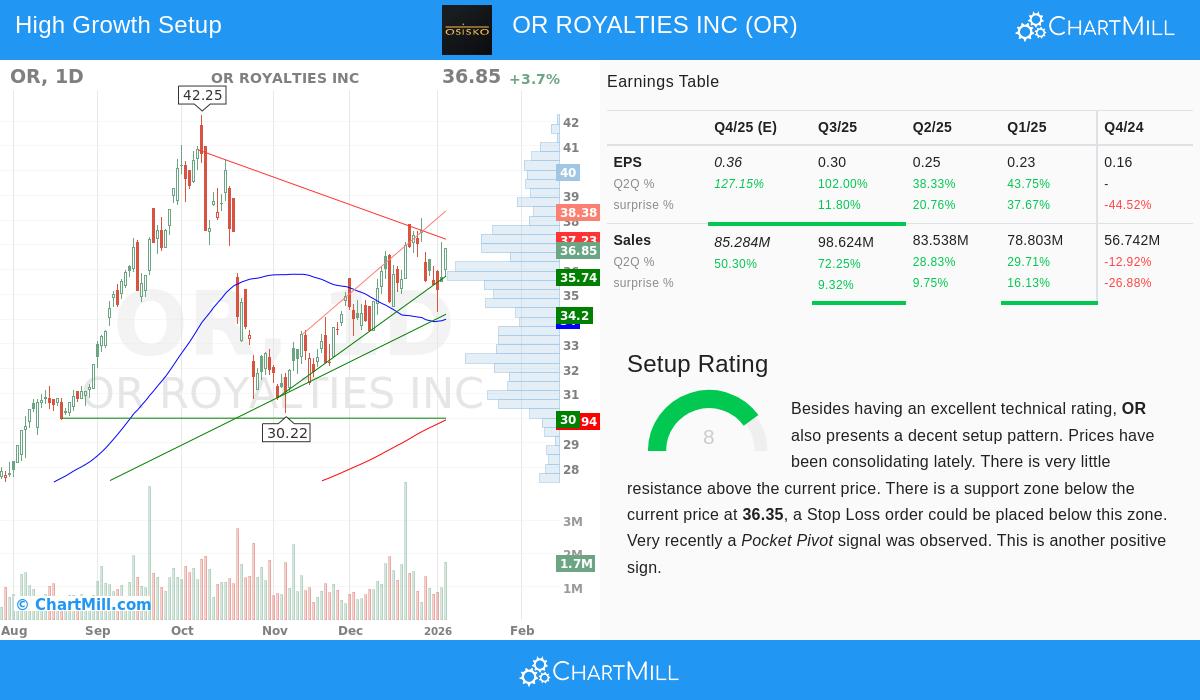
Fundamental Growth Momentum
The heart of the high growth momentum tactic is to find firms with quickening business results. OR Royalties displays several positive data points here, receiving a ChartMill High Growth Momentum Rating of 6. This rating combines important growth and momentum measures into one score.
- Earnings Acceleration: The firm's latest quarterly earnings per share increased by a notable 102% versus the same quarter last year. This comes after prior quarter-over-quarter growth rates of 38.3% and 43.8%, showing a strong reacceleration in earnings.
- Solid Sales Growth: Revenue growth has also jumped, with the last quarter showing a 72.3% year-over-year rise. This is a marked quickening from the 28.8% growth reported the quarter before.
- Profit Margin Expansion: A key signal of operational efficiency and pricing strength is growing profit margins. OR's profit margin in the last reported quarter was about 115.7%, a large expansion from 53.6% in the prior quarter and 12.8% two quarters earlier.
- Positive Estimate Revisions: Analysts have been increasing their projections, an important confirmation of momentum. The average estimate for next year's earnings has been adjusted upward by 2.1% over the past three months.
- Earnings Surprises: The firm has a record of exceeding expectations, beating EPS estimates in three of the past four quarters by an average of 6.4%.
These elements together describe a firm undergoing a strong rise in its financial performance, which is the main catalyst looked for by growth momentum investors.
Technical Condition and Formation Quality
While solid fundamentals give the "why" for a stock's possible movement, technical analysis assists with the "when." According to the detailed ChartMill Technical Report, OR receives a full 10 out of 10 on its Technical Rating and an 8 out of 10 for Formation Quality.
The full Technical Rating highlights the stock's sound condition across various time periods. It is in a confirmed long-term upward trend and shows solid relative performance, doing better than 92% of all stocks in the market over the previous year. The stock is trading above all its main moving averages (20, 50, 100, and 200-day), which are all in a rising arrangement, confirming the trend's condition.
The high Formation Rating of 8 shows the stock is currently in a positive period of sideways movement. After a solid upward advance, the price has been trading in a set range, letting it absorb gains and form a new base of support. The technical report notes that a recent "Pocket Pivot" signal was seen, a volume-based indicator often linked with institutional purchasing during a consolidation. The report finds a clear support area between $35.17 and $36.35, giving a logical zone for a stop-loss order, while nearby resistance is close to $37.23.
Match with the Tactic
This pairing is exactly what the screening method tries to catch. The high growth momentum measures (HGM Rating of 6) confirm the firm has the fundamental earnings and sales quickening that usually leads to continued price gains. The outstanding Technical Rating (10) confirms the market is already recognizing this fundamental condition, putting the stock in a leading position. Finally, the high Formation Rating (8) suggests the stock is not overbought but is instead tightening within a consolidation, possibly giving a lower-risk entry point before its next upward move. This meeting of factors tries to reduce risk by making sure an investor is not buying a worsening firm nor buying a stock that is technically overdone.
Locating Comparable Chances
Screens that sort for this exact pairing of solid fundamentals, technical condition, and actionable chart formations can help investors methodically find possible chances. The conditions used to locate OR Royalties, a High Growth Momentum Rating above 4, a Technical Rating above 7, and a Formation Rating above 7, can be used to the wider market.
You can run this screen yourself and see current results each day by going to the High Growth Momentum Breakout Formations page on ChartMill.
Disclaimer: This article is for information only and does not make up investment guidance, a suggestion, or an offer to buy or sell any securities. The study is based on given data and should not be the only foundation for an investment choice. Investors should do their own research and think about their personal money situation and risk comfort before making any investment.