
For investors looking to join strict technical rules with fundamental growth momentum, the method made popular by Mark Minervini gives an organized system. This method depends on the "Trend Template," a group of technical rules meant to find stocks in strong, confirmed uptrends. It requires agreement across several moving averages, closeness to new highs, and better relative strength. Importantly, Minervini combines this technical health with attention to speeding fundamental growth, specifically earnings and sales increase, to find companies not only rising on the chart, but doing so with the basic business force to possibly continue the rise. A "High Growth Momentum + Trend Template" filter uses this two-part check, looking for securities that meet the exact technical list while also displaying the fundamental traits of a high-growth company.
A Technical Leader: Meeting the Trend Template Rules
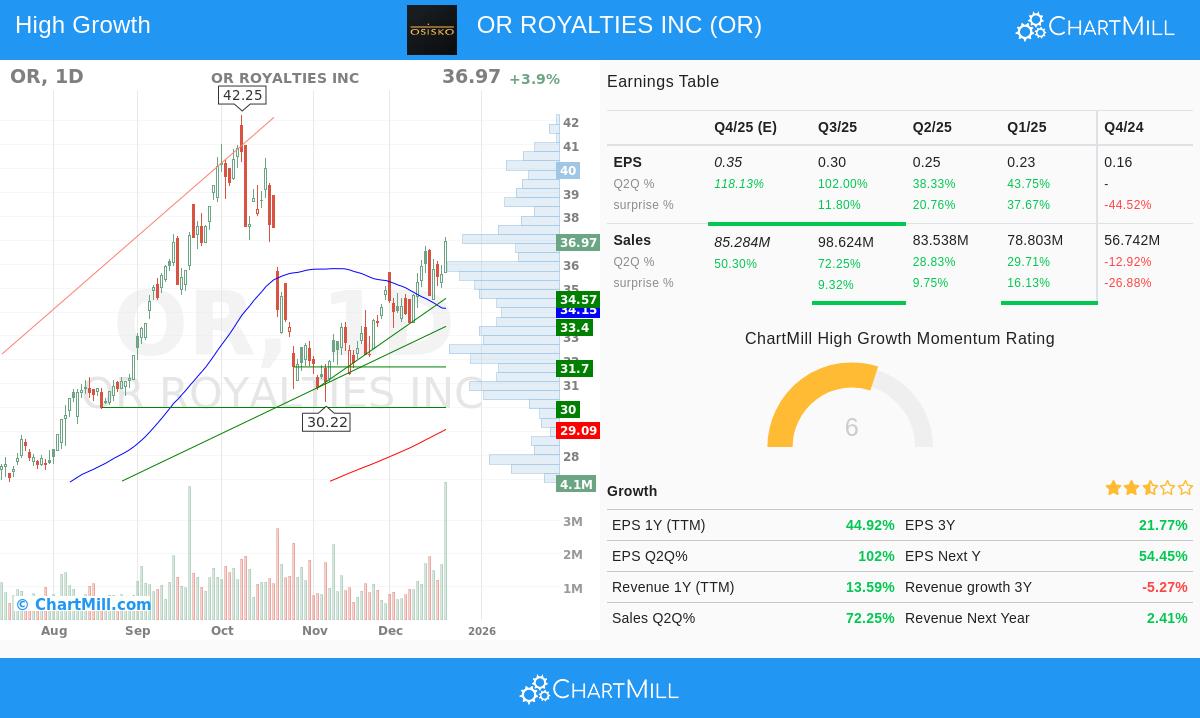
OR Royalties Inc (NYSE:OR) shows a strong technical view that matches closely with the Minervini Trend Template. The center of this template is confirming a stock is in a clear, multi-timeframe uptrend, which OR shows clearly.
- Price Above Important Averages: The stock's last price of $36.97 trades well above its 150-day ($31.53) and 200-day ($29.09) simple moving averages (SMAs). This is a basic need, showing a positive long-term trend.
- Moving Average Order: The 50-day SMA ($34.15) is above both the 150-day and 200-day SMAs, while the 150-day SMA is also above the 200-day. This "ordered" setup of shorter-term averages above longer-term ones is a standard sign of increasing bullish momentum.
- Closeness to Highs: An important Minervini rule is to focus on strength, not weakness. OR's current price is within 25% of its 52-week high of $42.25, meaning it is acting as a market leader instead of a laggard bouncing back from large losses. At the same time, the price is more than 30% above its 52-week low of $17.55, confirming a major recovery trend is already established.
- Better Relative Strength: With a ChartMill Relative Strength (CRS) score of 93.22, OR is doing better than over 93% of all stocks. Minervini notes that real market leaders regularly show high relative strength, as it points to institutional buying and money flow into the stock.
This combination of factors indicates OR is in a defined "Stage 2" advance, the exact phase where Minervini's method aims to take part.
The Growth Driver: Fundamental Force in View
While the chart sets the scene, the fundamental story supplies the energy for a continued rise. The High Growth Momentum (HGM) score judges the speed and quality of a company's earnings and sales increase, a key part of Minervini's "Specific Entry Point Analysis" (SEPA), which looks for stocks where getting better fundamentals act as a trigger. OR displays several solid growth measures:
- Earnings Speed Increase: The company shows strong quarterly earnings force. The latest quarter saw EPS grow 102% year-over-year, after growth of 38.3% and 43.8% in the two earlier quarters. This pattern of speeding up is a much-wanted signal.
- Solid Yearly Growth: On a trailing twelve-month (TTM) basis, EPS has grown almost 45%. Analysts are also becoming more positive, with the average guess for next year's EPS changed upward by over 11% in the last three months.
- Solid Profitability: The profit margin in the last reported quarter was very high at 115.7%, displaying the asset-light, high-margin style of the royalty business. While this number can change by quarter, the trend stays positive.
- Sales Turn: After some uneven quarters, sales growth has sped up again sharply, with the last quarter showing a 72.3% year-over-year gain. Future guesses also point to continued strength.
This fundamental picture shows the company is not only following a sector trend but is having real, company-specific growth that can draw more investor attention.
Technical Condition and Setup Review
ChartMill's own analysis gives a combined view of OR's technical position. The stock gets a high Technical Rating of 9 out of 10, reflecting its solid trend condition, very good relative performance, and positive momentum across short and long-term periods. Both the short-term and long-term trends are scored as positive, matching perfectly with the Trend Template review.
The Setup Quality Rating is 6, meaning that while the stock is technically very good, its recent price action has been a bit unstable, making a perfect, low-risk entry point less obvious at this precise time. The technical note says that the stock has been trading in a wide band over the past month and is now near the top of that band. For a trader following Minervini's rules closely, this indicates waiting may be needed, looking for a tighter consolidation or a "Volatility Contraction Pattern" (VCP) to form, giving a more defined turning point with a nearer stop-loss point.
A full breakdown of support and resistance points, volume review, and a sample trade setup are in the complete ChartMill Technical Report for OR.
Conclusion
OR Royalties Inc stands as a strong example for the Minervini-style growth and momentum method. It successfully meets the strict technical checks of the Trend Template, showing a clear and strong uptrend supported by better relative strength. Fundamentally, it pairs this technical health with speeding earnings, solid profit margins, and positive analyst changes, important parts that can act as triggers for more price gains.
The present review indicates the stock's main trend is strongly in place, making it a name for watchlists. The somewhat lower setup rating points out the need for careful entry timing, a central Minervini rule. Investors using this method would watch OR for the formation of a more organized base or VCP inside its ongoing uptrend, which could give a better-probability entry chance in line with both its technical path and fundamental force.
For investors wanting to find other securities that fit this two-part need of solid technical trends and high growth momentum, you can review the preset filter here: High Growth Momentum + Trend Template Screen.
Disclaimer: This article is for information and learning only. It is not meant as investment advice, a suggestion, or an offer or request to buy or sell any securities. The review is based on data thought to be dependable, but its correctness or fullness cannot be sure. Investing has risk, including the possible loss of original money. You should do your own study and talk with a qualified financial advisor before making any investment choices.