
OR Royalties Inc (NYSE:OR) has become a notable option for investors using a combined method of Mark Minervini’s trend-following system and high-growth momentum screening. This method focuses on finding stocks showing solid technical health—marked by continued upward trends, good performance compared to the market, and positive chart formations—while also displaying fundamental improvement in earnings, sales growth, and income. The process seeks to find stocks in the beginning or middle phases of major price increases, backed by both price movement and business progress.
Technical Strength and Trend Template Alignment
OR shows a clear match with Minervini’s Trend Template, a structured tool for spotting stocks in established upward trends. The template needs stocks to be priced above important moving averages, display increasing averages, present good momentum compared to past lows, and trade close to 52-week highs—all conditions OR now meets.
Key technical confirmations include:
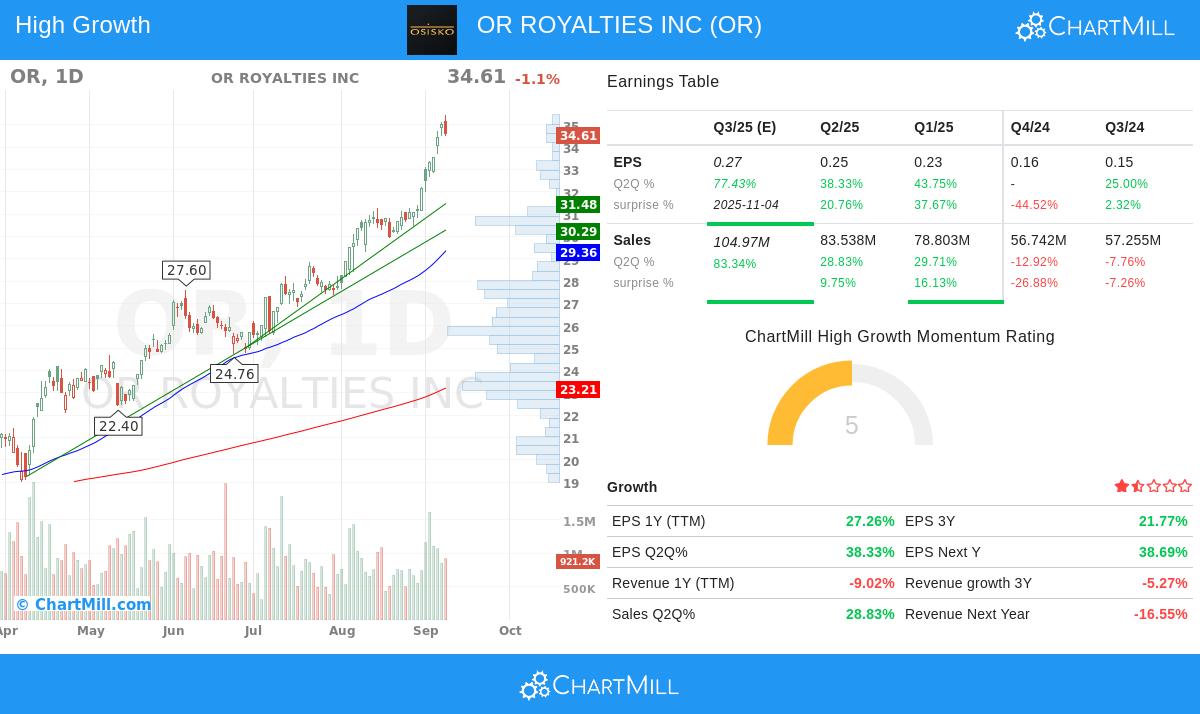
- The present price of $34.61 is higher than the increasing 50-day ($29.36), 150-day ($24.65), and 200-day ($23.21) simple moving averages.
- The 50-day moving average is higher than both the 150-day and 200-day averages, confirming mid-term health.
- With a 52-week high of $35.44 and a low of $17.55, the present price is 97% higher than its low and within 2.3% of its high, showing good recovery and movement.
- The stock’s relative strength rating of 93.54 shows it is doing better than almost 94% of all stocks, highlighting its market strength.
These elements together indicate OR is in a Stage 2 upward move—a period Minervini links with the most powerful and lasting price increases.
Fundamental Growth and Momentum Metrics
Beyond technicals, OR shows fundamental qualities that interest growth-focused investors. The company has reported major gains in income and business performance, which are vital for maintaining upward price movement.
Notable fundamental points include:
- Earnings per share (TTM) increased 27.3% year-over-year, getting to $0.79, with the latest quarterly EPS growth rising to 38.3%.
- The company has exceeded EPS predictions in three of the past four quarters, with an average beat of 4.06%, showing steady overperformance.
- Income margins have grown significantly, with the most recent quarter showing a margin of 53.6%, up from 46.7% in the previous quarter and 12.8% two quarters before.
- Free cash flow per share jumped 176% over the past year, showing better cash production and financial condition.
These measurements not only meet but also go beyond the usual limits for high-growth momentum investing, indicating that OR’s price health is backed by real business progress.
Alignment with Minervini’s SEPA Framework
Minervini’s Specific Entry Point Analysis (SEPA) method highlights the value of trend, fundamentals, catalysts, and exact entry points. OR’s technical position—holding near highs with good moving average support—provides a possible entry point after a clear move above $35.44. Fundamentally, the growth in income margins and earnings increase acts as a catalyst, possibly attracting institutional attention. The company’s focus on precious metal royalties and streams, especially its main asset at the Canadian Malartic mine, offers a clear business plan and revenue stability, further matching the strategy’s need for reliable growth sources.
Technical Analysis Summary
According to ChartMill’s technical report, OR has a top rating of 10/10, showing outstanding technical condition. The long and short-term trends are good, and the stock is trading near its 52-week high with good relative strength compared to both the wider market and its industry group. While the report states that the present formation misses perfect consolidation for a low-risk entry—leading to an average setup rating of 3—the overall technical picture stays solid. Support zones are found between $29.36-$30.29 and near $31.48-$31.73, offering possible areas for risk control.
Read the full technical report for OR here.
Conclusion
OR Royalties Inc presents a notable example of a stock that fits the strict requirements of both trend-following and high-growth momentum methods. Its good technical condition, along with improving fundamentals, places it as an option worth more study for investors looking for exposure to high-opportunity stocks in the metals and mining industry. As with all strategic methods, confirmation through ongoing tracking and careful risk control is necessary.
For more stocks that match this method, explore our High Growth Momentum + Trend Template screen.
Disclaimer: This article is for informational and educational purposes only and does not constitute investment advice. Investors should conduct their own research and consult with a qualified financial advisor before making any investment decisions.