
Exploring Growth Potential: ON HOLDING AG-CLASS A (NYSE:ONON) and Its Base Formation. Growth investors seek promising revenue and EPS growth, and ON HOLDING AG-CLASS A has come under our scrutiny for potential growth investing. While it's crucial to do your own research, we've detected ON HOLDING AG-CLASS A on our screen for growth with base formation, suggesting it merits a closer look.
What does the Growth looks like for ONON
ChartMill employs its own Growth Rating system for all stocks. This score, ranging from 0 to 10, is derived by evaluating different growth factors, such as EPS and revenue growth, taking into account both past performance and future projections. ONON has earned a 8 for growth:
- ONON shows a strong growth in Earnings Per Share. In the last year, the EPS has been growing by 199.72%, which is quite impressive.
- Looking at the last year, ONON shows a very strong growth in Revenue. The Revenue has grown by 29.36%.
- ONON shows a strong growth in Revenue. Measured over the last years, the Revenue has been growing by 54.06% yearly.
- ONON is expected to show a strong growth in Earnings Per Share. In the coming years, the EPS will grow by 22.67% yearly.
- The Revenue is expected to grow by 20.24% on average over the next years. This is a very strong growth
Understanding ONON's Health Score
ChartMill utilizes a Health Rating to assess stocks, scoring them on a scale of 0 to 10. This rating takes into account a variety of liquidity and solvency ratios, both in absolute terms and in comparison to industry peers. ONON has earned a 8 out of 10:
- ONON has an Altman-Z score of 8.92. This indicates that ONON is financially healthy and has little risk of bankruptcy at the moment.
- ONON has a Altman-Z score of 8.92. This is amongst the best in the industry. ONON outperforms 96.00% of its industry peers.
- The Debt to FCF ratio of ONON is 0.78, which is an excellent value as it means it would take ONON, only 0.78 years of fcf income to pay off all of its debts.
- ONON's Debt to FCF ratio of 0.78 is amongst the best of the industry. ONON outperforms 84.00% of its industry peers.
- ONON has a Debt/Equity ratio of 0.21. This is a healthy value indicating a solid balance between debt and equity.
- Looking at the Debt to Equity ratio, with a value of 0.21, ONON is in the better half of the industry, outperforming 64.00% of the companies in the same industry.
- A Current Ratio of 2.66 indicates that ONON has no problem at all paying its short term obligations.
- With a decent Current ratio value of 2.66, ONON is doing good in the industry, outperforming 74.00% of the companies in the same industry.
- A Quick Ratio of 2.03 indicates that ONON has no problem at all paying its short term obligations.
- ONON's Quick ratio of 2.03 is amongst the best of the industry. ONON outperforms 94.00% of its industry peers.
Profitability Examination for ONON
ChartMill's Profitability Rating offers a unique perspective on stock analysis, providing scores from 0 to 10. These ratings consider a wide range of profitability metrics and margins, both in comparison to industry peers and on their own merits. For ONON, the assigned 6 is a significant indicator of profitability:
- ONON has a Return On Assets of 10.19%. This is in the better half of the industry: ONON outperforms 80.00% of its industry peers.
- Looking at the Return On Equity, with a value of 17.41%, ONON is in the better half of the industry, outperforming 74.00% of the companies in the same industry.
- The Return On Invested Capital of ONON (10.67%) is better than 66.00% of its industry peers.
- The last Return On Invested Capital (10.67%) for ONON is above the 3 year average (9.76%), which is a sign of increasing profitability.
- ONON has a Profit Margin of 10.45%. This is amongst the best in the industry. ONON outperforms 86.00% of its industry peers.
- With a decent Operating Margin value of 9.12%, ONON is doing good in the industry, outperforming 64.00% of the companies in the same industry.
- In the last couple of years the Operating Margin of ONON has grown nicely.
- With a decent Gross Margin value of 60.63%, ONON is doing good in the industry, outperforming 80.00% of the companies in the same industry.
- ONON's Gross Margin has improved in the last couple of years.
Looking at the Setup
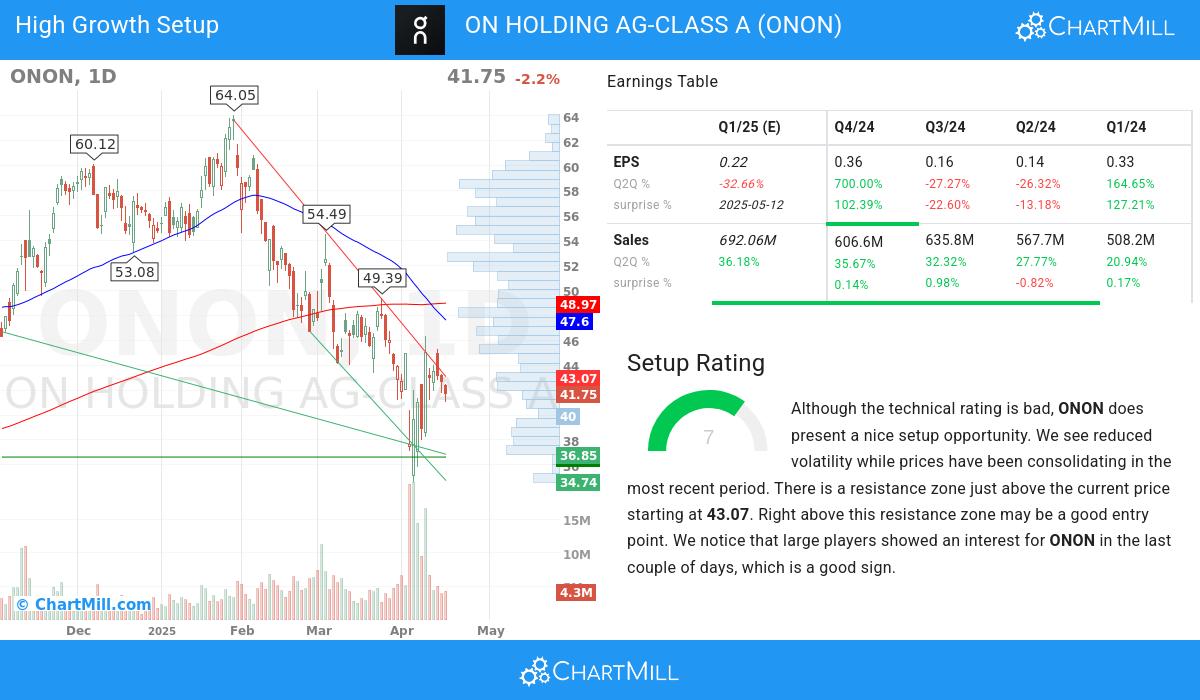
The Setup Rating of a stock determines to which extend the stock is consolidating. This score also ranges from 0 to 10 and is updated daily. The setup score evaluates various short term technical indicators. For ONON this score is currently 7:
Although the technical rating is bad, ONON does present a nice setup opportunity. We see reduced volatility while prices have been consolidating in the most recent period. There is a resistance zone just above the current price starting at 43.07. Right above this resistance zone may be a good entry point. We notice that large players showed an interest for ONON in the last couple of days, which is a good sign.
Every day, new Strong Growth stocks can be found on ChartMill in our Strong Growth screener.
For an up to date full fundamental analysis you can check the fundamental report of ONON
Our latest full technical report of ONON contains the most current technical analsysis.
Disclaimer
This article should in no way be interpreted as advice. The article is based on the observed metrics at the time of writing, but you should always make your own analysis and trade or invest at your own responsibility.