
Investors looking for chances in growth stocks often use a two-part method that mixes basic company strength with chart-based timing. The plan requires finding firms with very good financial condition, high profitability measures, and quickening growth, traits that point to long-term possibility, while also searching for positive price patterns that show a coming price surge. This technique tries to seize the upward move of fundamentally good firms right when they start a new rising trend, possibly increasing gains while controlling entry timing. One stock now matching this description is Universal Display Corp (NASDAQ:OLED).
Universal Display Corp focuses on organic light emitting diode (OLED) technologies and materials, providing for display and solid-state lighting markets in mobile devices, televisions, automotive uses, and augmented/virtual reality. The firm's owned UniversalPHOLED technology and wide intellectual property collection place it at the lead of energy-saving display progress, a field with strong growth momentum as worldwide need for improved screens keeps increasing.
Basic Strength Supports Growth Possibility
The company’s basic profile, shown in its basic analysis report, shows several strong traits that match growth investment rules. Universal Display has an overall basic rating of 7 out of 10, with very high marks in profitability (8/10) and financial condition (9/10). These scores are vital for growth investors, as they show a firm’s skill to keep growing without too much debt or operational uncertainty.
- Profitability Measures: The company shows outstanding margins, with a gross margin of 77.19% and an operating margin of 38.93%, doing better than over 95% of its semiconductor industry competitors. High profitability lets firms put money back into new ideas and market growth, main forces for long-term expansion.
- Financial Condition: With no unpaid debt, a current ratio of 8.05, and a quick ratio of 6.39, Universal Display shows notable liquidity and solvency. This financial steadiness lowers risk during market drops or industry changes, making sure the company can pay for growth plans from within.
- Growth Path: Even though recent income had a drop, the firm’s earnings per share (EPS) increased by 9.87% over the last year, and experts predict future EPS growth at 20.56% each year along with income growth of 17.10%. Quickening growth rates point to better operational effectiveness and market need alignment.
These basic qualities are necessary for growth investment, as they show a firm’s ability to benefit from growing markets while keeping operational quality. Universal Display’s strong IP collection and place in the fast-growth OLED field further support its possibility to do better than sector competitors.
Chart Pattern Indicates Coming Surge
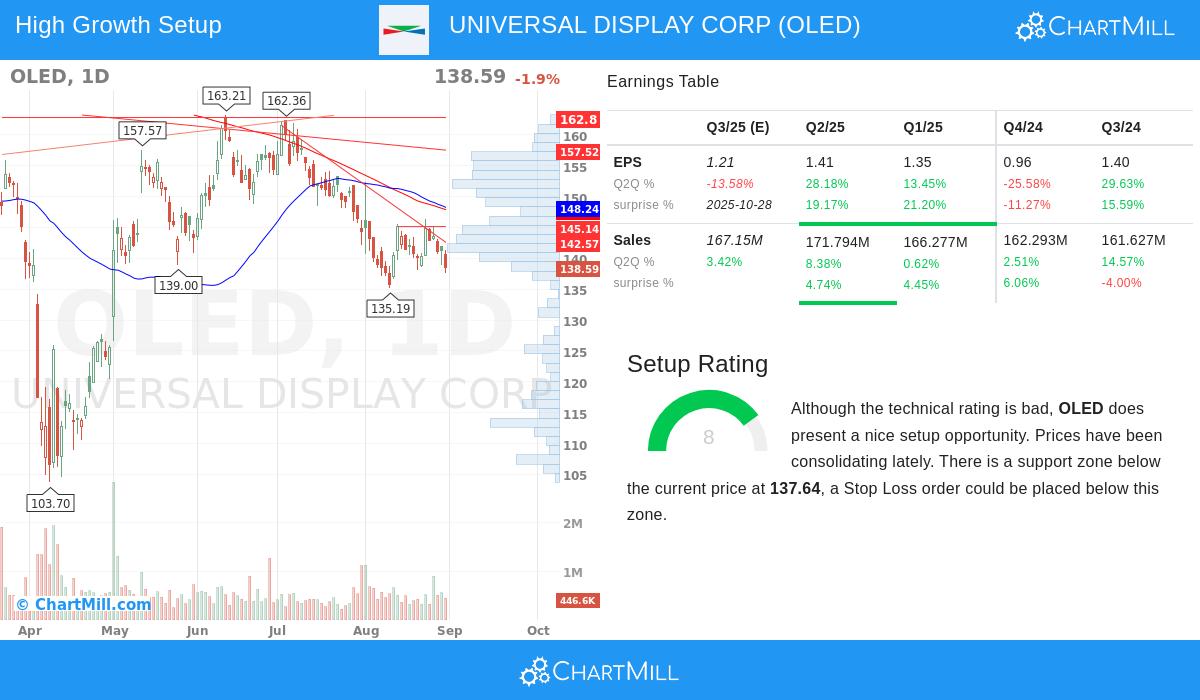
From a chart-based view, Universal Display’s price pattern shows an interesting chance even with recent softness. The chart analysis report points out a setup rating of 8/10, showing a period of sideways movement that frequently comes before a surge. The stock is now trading close to an important support area between $135.80 and $137.64, with several resistance levels above that might be tried if buying force returns.
- Sideways Movement Pattern: After a big fall from its 52-week peak, the stock has been moving between $135.19 and $146.29 over the last month. This kind of sideways movement often shows a time of gathering, where knowledgeable investors take positions before a possible upward price change.
- Support and Resistance Levels: The found support area gives a sensible level for stop-loss orders, controlling downside risk. A move above close resistance near $142,$145 might start more increases toward higher resistance areas, matching the stock’s past price swings and trend makeup.
- Market Situation: While the S&P 500 shows positive short and long-term trends, Universal Display has fallen behind the wider market, possibly giving a catch-up chance if chart conditions get better along with its solid basics.
This chart setup is especially important for growth investors because it allows for planned entry points in basically strong firms during short-term price softness. The mix of strong financials with a positive price pattern raises the chance of a good investment.
Conclusion
Universal Display Corp shows a strong example where solid basic growth measures meet a hopeful chart setup. The firm’s top part in OLED technology, very good profitability, no-debt balance sheet, and quickening earnings forecasts give a firm base for long-term value increase. At the same time, its present chart-based sideways movement near support levels offers a possible entry point for investors expecting a surge.
For investors wanting to look into similar chances, our preset screen for Strong Growth Stocks with Good Technical Setup Ratings often finds firms showing this strong mix of growth basics and chart-based timing.
,
Disclaimer: This article is for informational purposes only and does not constitute investment advice. The content should not be interpreted as a recommendation to buy, sell, or hold any security. Always conduct your own research and consider your financial situation and risk tolerance before making investment decisions.