
A common challenge for investors is finding companies that are not only fundamentally sound and expanding but are also at a point where market momentum is joining with that soundness. One method to spot such opportunities is by joining careful fundamental study with technical chart patterns. The approach centers on finding stocks displaying firm growth traits, such as speeding up revenue and earnings, while also keeping firm financial condition and earnings. These fundamental traits are then sorted using a technical view to find stocks that are moving out of sideways patterns or indicating fresh momentum, pointing to institutional buying and a possible extension of the upward move. This two-part method tries to seize companies where better business fundamentals are being seen and responded to by the wider market.
NEXTPOWER INC-CL A (NASDAQ:NXT) presents a notable example for this investment method. The company, a top provider of integrated solar tracker and software answers, works directly inside the high-expansion renewable energy field. Its goods are key for utility-scale solar projects, placing it to gain from the worldwide shift toward electrification and clean energy.
Fundamental Strength: The Engine for Growth
The base idea of this method is that lasting price gains are finally pushed by a company's financial results. Nextracker's fundamental picture, as laid out in its fundamental analysis report, shows the firm engine that might push future expansion. The company gets an overall fundamental score of 7 out of 10, with very high marks in important areas:
- High Profitability (Score: 9/10): Nextracker is not just expanding, it is expanding with earnings. Key measures greatly exceed industry others:
- Return on Invested Capital (ROIC) of 23.73%, beating 98% of its industry.
- An operating margin of 22.21%, higher than 99% of others.
- A profit margin that has shown steady gain in recent years.
- Firm Financial Condition (Score: 8/10): The company holds no debt, giving great financial room and lowering risk. Its Altman-Z score of 5.99 points to a very small near-term chance of financial trouble.
- Notable Growth Path (Score: 8/10): The growth needs are clearly satisfied, with past results showing large rises:
- Revenue expanded over 20% in the past year.
- Earnings Per Share (EPS) expanded by 22.25% over the past year and has a 3-year average yearly growth rate of almost 33%.
This mix is key for the method. Firm profitability and condition ensure the company can pay for its own growth and handle economic changes, while the high expansion rates give the reason for possible market beating results.
Technical Setup: The Market's Vote of Confidence
While firm fundamentals are needed, the technical study shows when the market is starting to value this soundness. Nextracker's technical analysis report gives a high score of 9 out of 10, seeing a "steady result in both the short and longer term time frames."
The stock is in a clear long-term upward trend, trading well above its main moving averages (50-day, 100-day, and 200-day). More key for the breakout method, the study spots a specific setup:
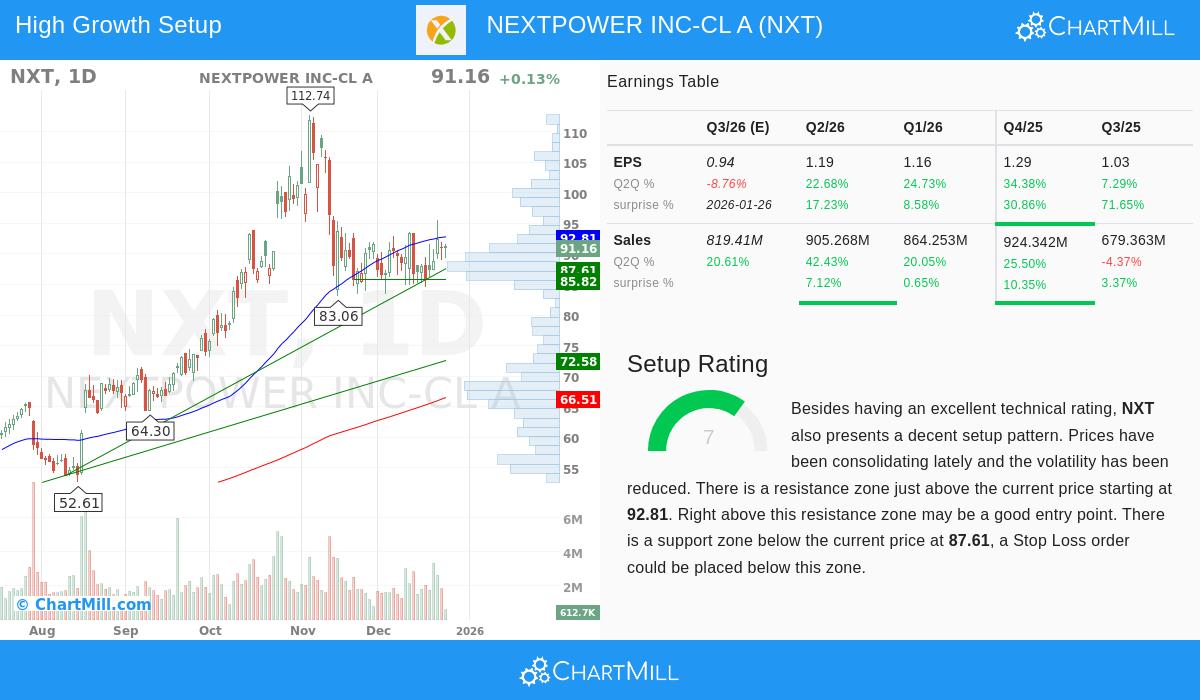
- The stock has been moving sideways in a zone between about $83.50 and $95.49 over the past month, forming a base after a large earlier rise.
- A clear resistance area sits just above the present price, from $92.81 to $93.43. A clear move above this area might mark a breakout and the restart of the earlier upward trend.
- The method sees such a breakout as a possible entry sign, suggesting that buying force is beating selling force at a key point, often a mark of fresh institutional buying.
This technical shape is what the screen exactly looks for: a fundamentally sound growth stock that is resting or building a base before a possible next step up. It matches the timing of an investment with a time of expected momentum.
Valuation and Industry Context
Even with its growth, Nextracker's valuation stays fair compared to its industry. Its Price-to-Earnings (P/E) ratio of 19.5 is lower than 85% of its others in the Electrical Equipment industry and is also under the present S&P 500 average. When joined with its high profitability measures, this hints the market may not be completely valuing its quality and growth picture, giving a possible buffer—a key thought for growth investors aware of paying too much for future possibility.
A Candidate for Further Research
Nextracker shows the kind of chance a joined fundamental and technical screen tries to find. It works in a long-term growth market, shows top-level profitability and financial soundness, and its stock chart indicates a positive shape hinting the market may be getting ready for its next action. The existence of a clear resistance level gives a set technical mark for investors to observe.
For investors wanting to use this method to find other possible chances, the set "Strong Growth Stock Technical Setups" screen is ready for more study. You can see the present screen results and rules here.
Disclaimer: This article is for informational and educational purposes only and does not constitute investment advice, a recommendation, or an offer or solicitation to buy or sell any securities. The analysis presented is based on data and reports available at the time of writing and may change. Investors should conduct their own thorough research and consider their individual financial circumstances and risk tolerance before making any investment decisions. Past performance is not indicative of future results.