
Technical analysis investors often look for stocks that combine solid basic momentum with defined entry points, and one technique for finding these chances involves scanning for securities with both strong technical scores and good setup formations. This method helps find stocks that are not only in confirmed uptrends but also moving sideways in a manner that indicates a coming price surge, offering a good risk-reward situation. NEWS CORP - CLASS A (NASDAQ:NWSA) recently appeared in such a scan, showing traits that might interest traders concentrating on technical breakouts.
Technical Strength and Trend Consistency
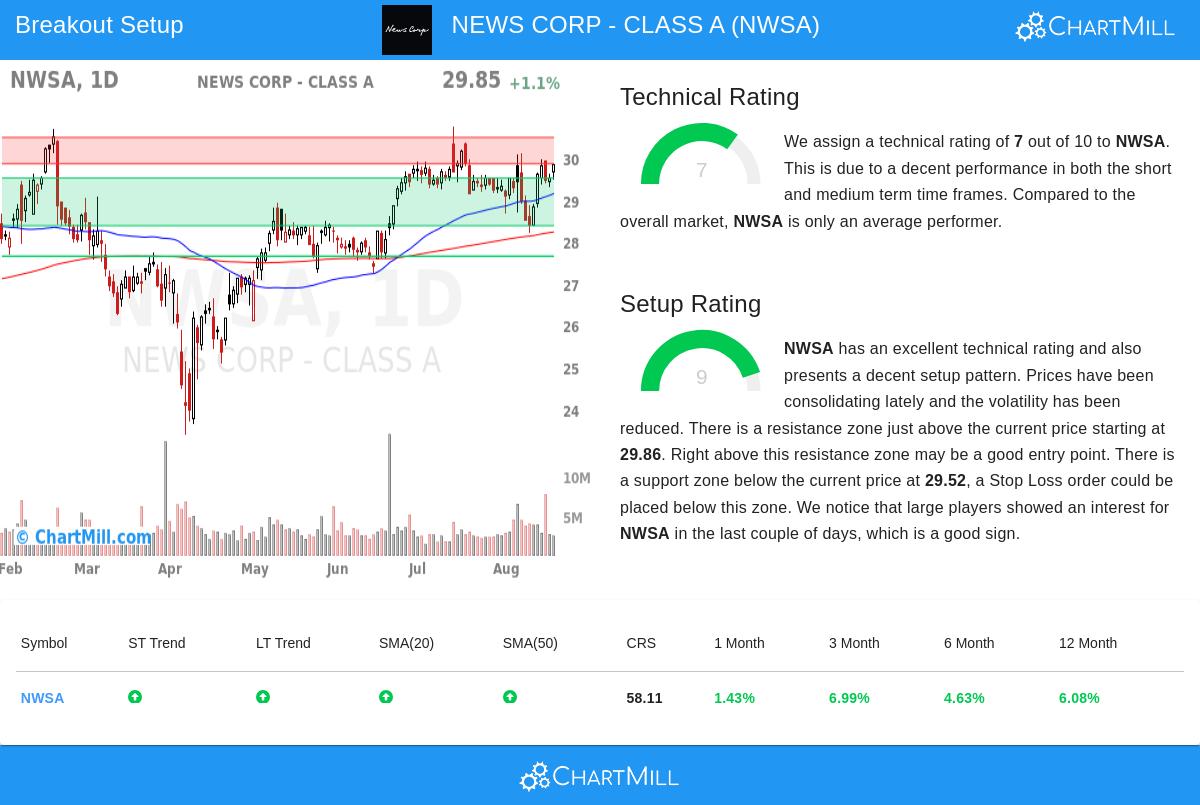
A basic part of breakout trading is the stock’s general technical condition, which confirms the asset is placed in a lasting uptrend. NWSA’s technical score of 7 shows good momentum over various periods. Both its near-term and longer-term trends are bullish, showing agreement between recent price moves and wider directional movement. The stock is trading above important moving averages, including the 20-day, 50-day, 100-day, and 200-day SMAs, which are all climbing, confirming the trend's force. This is important since a strong technical score frequently links to less chance of failed breakouts and a higher probability that upward moves will continue. Also, NWSA is trading in the higher part of its 52-week span, though it is a bit behind the wider market; this is not always a bad point, as it can mean potential for more gains compared to similar companies.
Setup Quality and Consolidation Pattern
While technical strength finds which stocks to watch, setup quality deals with when to get in. NWSA’s setup score of 9 points to a clear consolidation period, marked by lower volatility and trading inside a set range. Over the last month, the stock has moved between $28.21 and $30.11, with recent action tightening close to the top of this span. This kind of narrow price movement often comes before a big move, as it shows a balance of buying and selling pressure that is likely to break. The setup is made stronger by clear support and resistance areas. A key support zone is between $28.38 and $29.52, made from a combination of trendlines and moving averages, giving a sensible place for stop-loss orders. Resistance is seen between $29.86 and $30.49; a clear move above this area might indicate the beginning of a new upward phase. Big investors have also taken notice of NWSA lately, as shown by volume-related measures, supporting the chance for a maintained breakout.
Trade Structure and Risk Management
Using the technical and setup reviews, a sample trade plan recommends an entry at $30.50, just over the resistance area, with a stop-loss at $28.20. This caps the possible loss to about 7.54% of the trade value, or near 1% of portfolio funds if the position size is correct. It is essential to recall that such formations are not certainties—they only point out situations where the odds might be good. Always think about outside elements like approaching earnings or industry news before proceeding. For a more detailed review of NWSA’s technical picture, see the full technical report.
Investors searching for similar chances can check other technical breakout possibilities using the Technical Breakout Setups screen, which regularly scans the market for stocks showing high technical and setup scores.
Disclaimer: This article is for informational purposes only and does not constitute investment advice. Trading securities involves risk, and individuals should conduct their own research or consult a financial advisor before making investment decisions.