
Technical investing strategies often focus on identifying stocks with strong underlying momentum that are simultaneously forming consolidation patterns, offering favorable risk-reward entry points. One approach involves screening for securities exhibiting both high technical health scores and quality setup ratings, which together suggest potential breakout opportunities. This methodology helps investors pinpoint equities that not only demonstrate solid price trends but are also positioned near actionable support and resistance levels, reducing guesswork in trade timing.
Envista Holdings Corp (NYSE:NVST) recently surfaced in such a technical breakout screen, displaying characteristics that may appeal to momentum and breakout-focused traders. The dental products manufacturer shows a notable combination of technical strength and pattern formation, suggesting it warrants closer examination for those employing trend-following strategies.
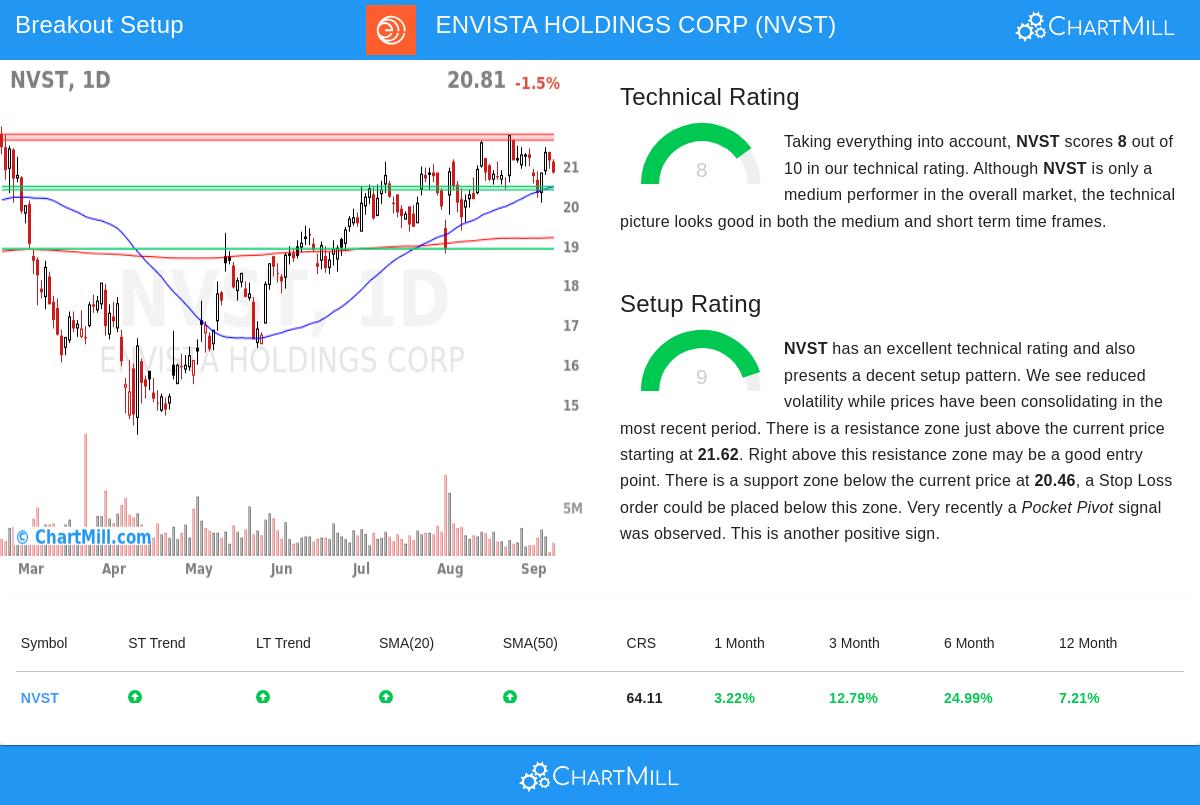
Technical Strength Assessment
Envista Holdings demonstrates solid technical foundations, scoring an 8 out of 10 on the ChartMill Technical Rating scale. This rating evaluates multiple factors including relative strength, trend direction, and moving average positioning across various timeframes. Key technical positives include:
- Both short-term and long-term trends are positive, indicating alignment across time horizons
- The stock outperforms 72% of its Health Care Equipment & Supplies industry peers
- Price sits above all major moving averages (20, 50, 100, and 200-day), with each average trending upward
- Recent performance shows strength with 3.2% (1-month), 12.8% (3-month), and 25.0% (6-month) gains
These factors collectively suggest NVST maintains healthy technical momentum, an important foundation for breakout strategies since strong underlying trends increase the probability that breakouts will sustain rather than quickly reverse.
Setup Quality Evaluation
Perhaps more notable is NVST's setup quality, which scores an exceptional 9 out of 10. This rating identifies consolidation patterns that often precede significant price movements. Current observations include:
- Prices have consolidated between $20.06 and $21.73 over the past month, creating a defined trading range
- Recent volatility has decreased, indicating potential energy building for a directional move
- A recent pocket pivot signal was detected, suggesting institutional accumulation
- Three distinct support zones exist below current price levels, providing clear areas for stop-loss placement
The setup quality is particularly important for breakout strategies because it identifies periods where risk can be clearly defined through support levels while potential reward exists if price breaks above resistance.
Resistance and Entry Considerations
The technical analysis identifies two primary resistance zones:
- Immediate resistance between $21.62 and $21.77
- Secondary resistance between $22.29 and $22.33
For breakout traders, a move above the $21.62-$21.77 zone could signal an entry opportunity, with initial price targets toward the higher resistance area. The proximity of current price ($20.81) to these resistance levels makes NVST particularly interesting for near-term breakout watchlists.
Risk Management Factors
The presence of multiple support levels provides natural areas for risk management:
- Primary support between $20.37 and $20.46
- Secondary support at $18.89 and $18.43
These defined support zones allow traders to place stop-loss orders with clear technical justification rather than arbitrary price points. The stock's average true range of 2.78% also provides context for setting position sizes appropriate for its volatility profile.
Traders seeking similar technical breakout opportunities can explore additional candidates through ChartMill's Technical Breakout Setups Screen, which regularly identifies securities exhibiting both strong technical ratings and high-quality setup patterns.
Disclaimer: This analysis is based on technical indicators and pattern recognition and should not be considered investment advice. All trading and investment decisions involve risk, and readers should conduct their own research and consult with a qualified financial professional before making any investment decisions. Past performance does not guarantee future results.