
Investors looking to find high-potential stocks frequently use systematic frameworks that mix strict technical analysis with fundamental growth measures. One well-known method is the strategy made popular by Mark Minervini, which centers on finding market leaders in clear uptrends. This method uses a specific Trend Template to sort for stocks with sound technicals and pairs it with an examination of earnings and sales momentum to confirm the core business is gaining speed. The aim is to locate securities where strong price trends are backed by fundamental progress, providing a combination of forces that can come before major price movements.
NU HOLDINGS LTD/CAYMAN ISL-A (NYSE:NU) offers an interesting example for this dual method. As a digital banking platform operating in Latin America, the company has taken considerable market share and shown fast expansion. An inspection of its technical position and fundamental path indicates it fits well with the standards looked for by growth-focused momentum strategies.
Technical Fit with the Minervini Trend Template
The Minervini Trend Template is made to sort for stocks showing definite, maintained uptrends, making sure an investor is moving with the existing momentum. NU's chart presently meets the main technical list:
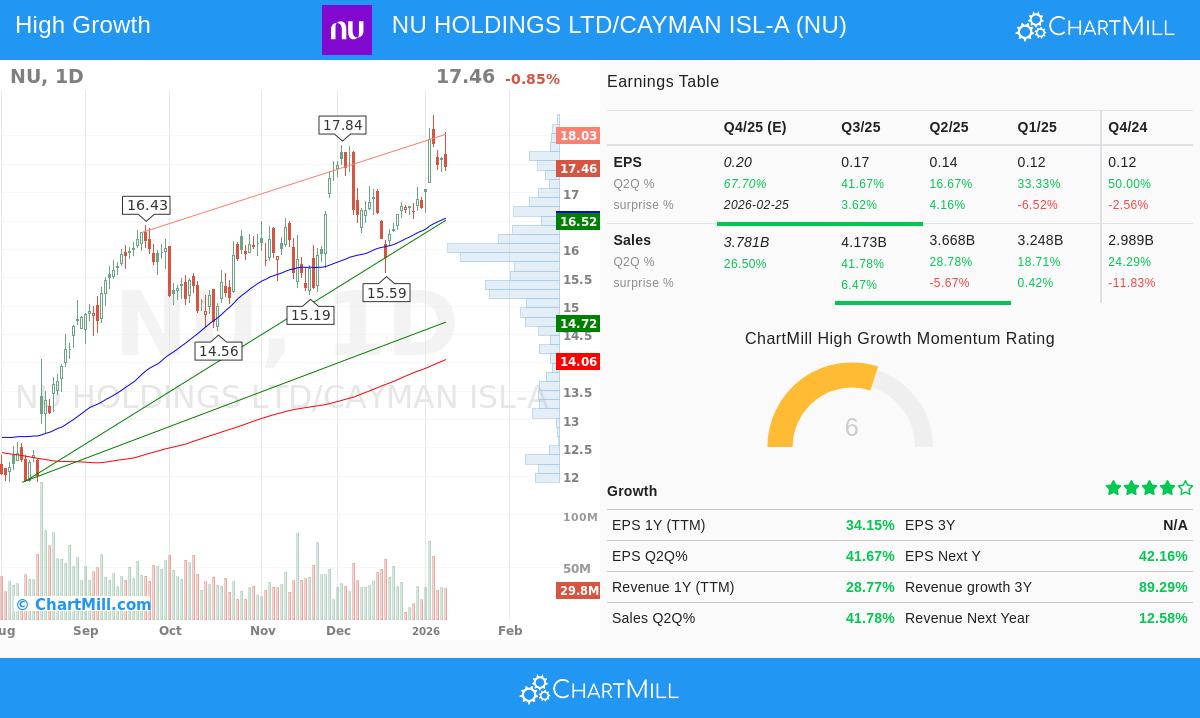
- Price Above Key Moving Averages: The stock trades notably above its rising 50-day ($16.55), 150-day ($14.85), and 200-day ($14.06) simple moving averages. This layered order signals positive momentum across short, intermediate, and long-term periods.
- Moving Average Order: The 50-day moving average is positioned above both the 150-day and 200-day averages, and the 150-day is above the 200-day. This sequence verifies a sound, set uptrend.
- Nearness to Highs: With a present price around $17.46, NU is within 5% of its 52-week high of $18.37, fitting the template's focus on strength. It is also trading more than 90% above its 52-week low, signaling a strong recovery and trend.
- Strong Relative Strength: A main part of Minervini's thinking is to concentrate on market leaders. NU has a ChartMill Relative Strength (CRS) rating of 89.69, meaning it has done better than almost 90% of the market over the last year. This leadership is a key sign of stocks ready for more gains.
This technical view indicates a stock in a verified Stage 2 advance, the main phase where Minervini's strategy aims to be involved.
Fundamental Driver for High Growth Momentum
A sound chart is only part of the narrative. The Minervini method strongly stresses that the biggest price moves are driven by quickening fundamental results. This is where the High Growth Momentum (HGM) review becomes important, and NU's financial measures show a strong engine below the surface.
- Earnings Growth: The company is reporting solid and quickening profitability. Earnings per share (EPS) for the trailing twelve months increased more than 34% year-over-year. More notably, recent quarterly EPS growth has sped up, reported at 41.7% last quarter, after 16.7% and 33.3% growth in the earlier periods. This sequence of acceleration is a primary focus for growth investors.
- Profit Margin Gains: Beyond revenue growth, better efficiency is key. NU's profit margin in the last reported quarter was 18.75%, up from 17.36% the prior quarter. Growing margins imply pricing ability and operational scale, which can greatly increase bottom-line growth.
- Revenue Growth Path: The company's revenue growth stays strong at 28.8% over the past year on a TTM basis. The latest quarter saw growth increase to 41.8%, showing continued demand for its digital banking products.
- Positive Earnings Revisions: Analyst opinion is becoming more favorable, a main catalyst Minervini monitors. Estimates for next year's earnings have been raised by almost 5% over the last three months, showing increasing belief in the company's short-term outlook.
These measures together describe a company not only expanding, but doing so with greater pace and efficiency, the precise fundamental setting that can maintain and drive a sound technical trend.
Technical Condition and Formation Review
Beyond the specific Trend Template, a wider technical study of NU supports its strength. According to ChartMill's own report, the stock receives a complete Technical Rating of 10 out of 10, showing very good health across several timeframes. Both its long-term and short-term trends are graded as positive, and it does better than 91% of its counterparts in the Banks industry.
The report states the stock is currently showing a bull flag formation, a generally positive continuation pattern that happens after a strong rise. While the overall setup quality is graded a 6, pointing to some recent price swings, the report finds clear support areas between $16.39-$16.55 and $15.32-$15.36, which can act as reasonable zones for managing risk.
For a complete look at the support, resistance, and trade setup review, you can see the full ChartMill Technical Report for NU.
A Subject for More Study
NU Holdings shows the kind of security that systematic growth and momentum filters try to identify. It shows the organized technical traits of the Minervini Trend Template, suggesting involvement in a sound uptrend. At the same time, its fundamental picture shows the high-speed growth, noted by quickening earnings, growing margins, and positive estimate changes, that supplies the driver for such trends to persist.
For investors wanting to locate similar candidates that satisfy both strict technical and high-growth fundamental requirements, more study can be done using the High Growth Momentum + Trend Template screen.
Disclaimer: This article is for informational and educational purposes only. It is not a recommendation to buy or sell any security. The analysis is based on current data and methodologies, which are subject to change. All investing involves risk, including the potential loss of principal. You should conduct your own research and consult with a qualified financial advisor before making any investment decisions.