
NUTANIX INC - A (NASDAQ:NTNX) has become an interesting option for investors using systematic growth and momentum methods. The stock was found through a screening process that joins Mark Minervini's detailed Trend Template with a High Growth Momentum (HGM) score, a system made to find equities displaying both good technical condition and solid fundamental growth traits. This two-part method tries to find market leaders that are not only in strong uptrends but are also supported by improving business fundamentals, trying to find stocks before they see major price increases.
Technical Strength and the Trend Template
The Minervini Trend Template gives a systematic structure for finding stocks in a confirmed stage 2 uptrend, which is defined by continued upward momentum and relative strength. NUTANIX INC - A shows a good fit with these technical standards, a basic part of the strategy that helps avoid stocks in resting or falling periods.
Key technical numbers for NTNX include:
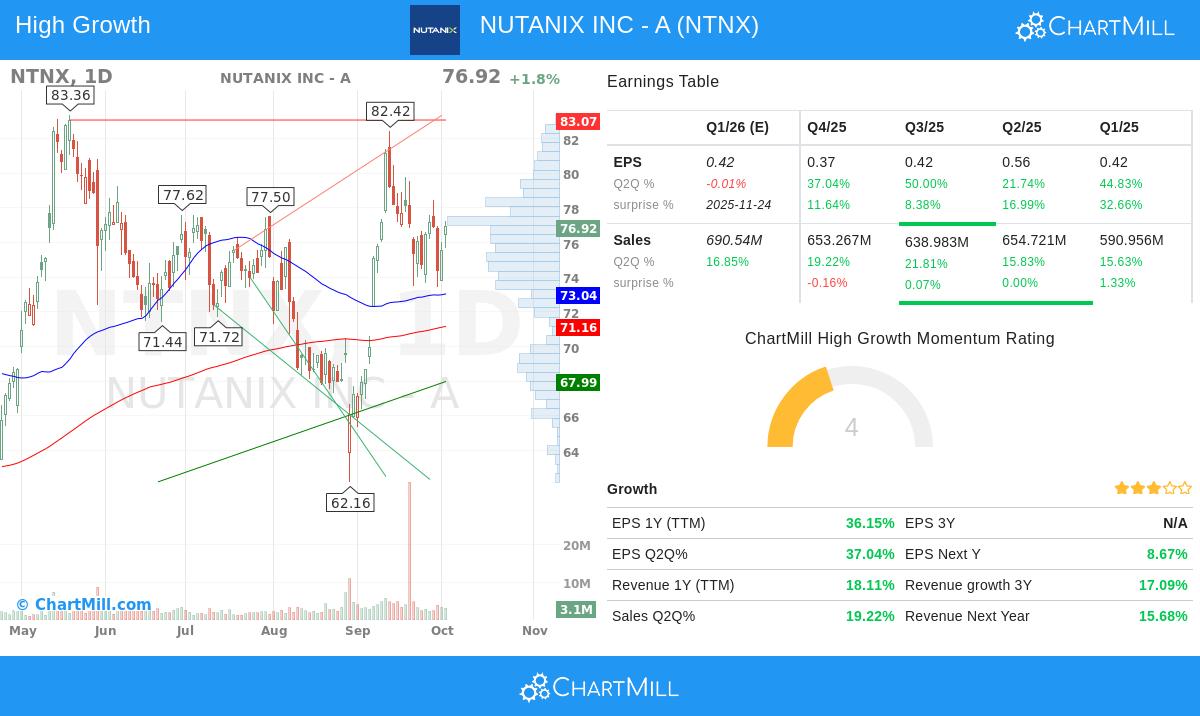
- Price vs. Moving Averages: The current price of $76.92 trades above its rising 50-day ($73.04), 150-day ($72.62), and 200-day ($71.16) simple moving averages. This ordered arrangement is a typical sign of a sound uptrend across several timeframes.
- Moving Average Trends: Importantly, the 150-day and 200-day moving averages are both in clear uptrends, confirming positive long-term momentum.
- Proximity to Highs: The stock is trading within 10% of its 52-week high of $83.36, showing it has the strength common in market leaders, as highlighted in Minervini's philosophy. It also sits more than 40% above its 52-week low, indicating a strong recovery and growth pattern.
- Relative Strength: With a ChartMill Relative Strength (CRS) score of 74, NTNX is doing better than almost three-quarters of the market. While not in the top 90s, this still means solid performance relative to the wider market, a main idea of the strategy for finding leading stocks.
Fundamentals for High Growth Momentum
Beyond a good technical picture, the strategy needs proof of fundamental improvement, as "big earnings attract big attention." NTNX's financial numbers show a company in a strong growth period, supporting its HGM score.
The company's earnings ability is especially notable:
- Earnings Per Share (EPS) Growth: The trailing twelve-month (TTM) EPS has grown by over 36% year-over-year. Recent quarterly performance is even more notable, with the last quarter showing 37% growth and the quarter before that increasing 50% compared to the same times a year earlier.
- Earnings Surprises: A major sign of fundamental momentum is a company's ability to regularly beat expectations. NTNX has exceeded EPS estimates in all of the last four quarters, with an average surprise of over 17%, frequently a trigger that draws institutional buying.
- Revenue Growth: Top-line growth remains solid, with TTM revenue up 18% and the last quarter growing nearly 20% year-over-year. This shows that earnings growth is backed by increasing business operations.
- Profitability: The company has reached consistent profitability, with a profit margin of 5.9% in the most recent quarter. This change to continued profitability is an important milestone for high-growth software companies.
Technical Analysis and Setup Outlook
The technical report for NTNX gives the stock a solid score of 7 out of 10, reflecting its acceptable performance across short and medium-term timeframes. The analysis states that while the long-term trend is positive, the short-term trend is currently neutral, suggesting the stock may be in a resting phase inside its larger uptrend. This resting has made a trading range between about $69 and $82 over the past month, possibly giving a planned entry point.
The report finds two key support areas, the most important ranging from $66.06 to $67.99, made by a mix of trendlines. On the resistance side, a move above the $78.61 level could indicate a restart of the upward trend, with the next major resistance area located between $82.77 and $83.07. The setup summary states that NTNX "has an excellent technical rating and also presents a decent setup pattern," with lower volatility and little immediate overhead resistance.
For a detailed look at the support, resistance, and automated trade setup, you can check the full technical analysis report for NTNX.
Conclusion
NUTANIX INC - A presents an interesting case for investors following a structured growth and momentum strategy. The stock meets the detailed technical requirements of the Minervini Trend Template, confirming its place in a stage 2 uptrend. Also, its basic business shows the kind of improving earnings and revenue growth, along with regular earnings surprises, that describe a high-growth momentum option. The current technical setup indicates the stock is resting inside its uptrend, possibly giving a chance for investors looking for exposure to a company with good technical and fundamental supporting factors.
This analysis was built on a specific screen made to find such options. To see other stocks that currently fit this "High Growth Momentum + Trend Template" requirements, you can view the complete screen results here.
Disclaimer: This is not financial advice. The content is intended for informational and educational purposes only. Always conduct your own research and consider your individual financial situation before making any investment decisions.