
NUTANIX INC - A (NASDAQ:NTNX) has been identified by our High Growth Momentum + Trend Template screen as a stock that aligns with Mark Minervini’s strategy. The company demonstrates strong technical trends and high-growth fundamentals, making it a potential candidate for momentum and growth investors.
Why NTNX Fits the Minervini Trend Template
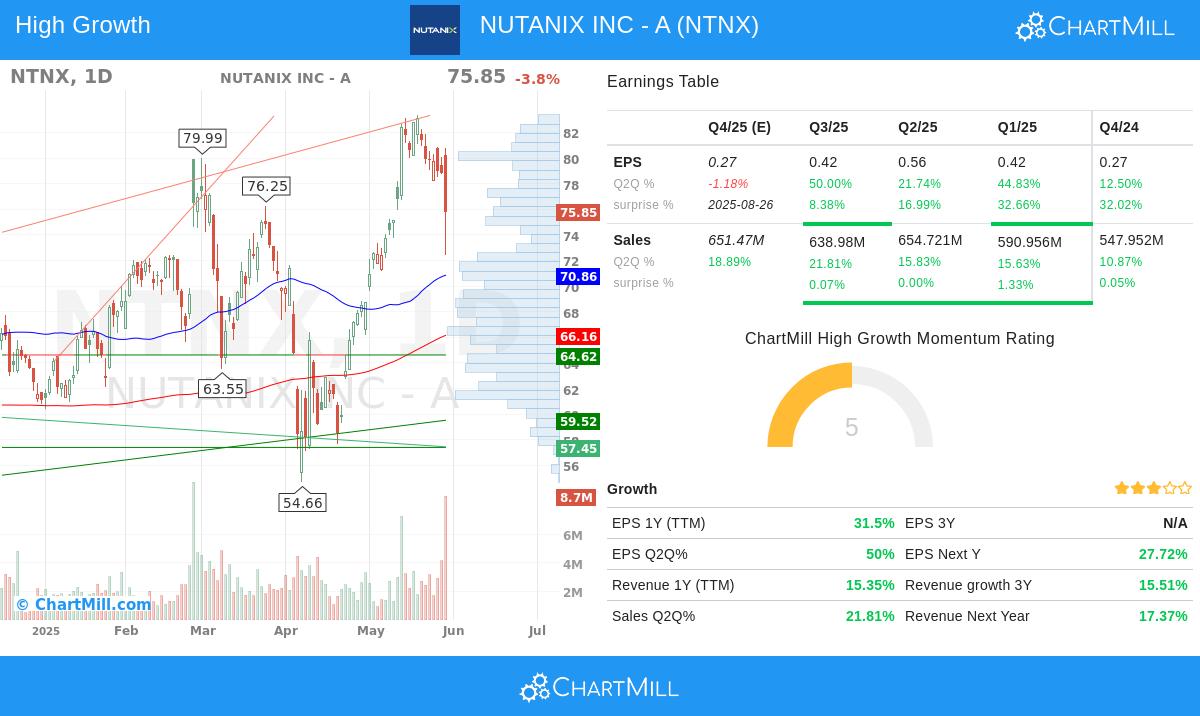
The Minervini Trend Template focuses on stocks exhibiting strong uptrends with key technical confirmations. NTNX meets these criteria:
- Price Above Key Moving Averages: The stock trades above its 50-day ($70.86), 150-day ($68.60), and 200-day ($66.16) moving averages, confirming a bullish trend.
- Upward-Sloping Averages: The 150-day and 200-day moving averages are rising, indicating sustained upward momentum.
- Relative Strength: With a ChartMill Relative Strength score of 87.04, NTNX outperforms 87% of the market.
- Price Near 52-Week High: At $75.85, NTNX is within 10% of its 52-week high ($83.36), showing strong momentum.
- Volatility Contraction: While the setup rating is currently moderate (3/10), the stock has shown consolidation potential in recent months.
High Growth Fundamentals
Beyond technical strength, NTNX displays robust growth metrics:
- Earnings Growth: EPS grew 136.4% year-over-year (FY), with quarterly EPS growth accelerating to 50% in the most recent quarter.
- Revenue Growth: Revenue increased 15.3% year-over-year (TTM), with consistent quarterly growth above 15%.
- Profitability Improvement: The latest quarter’s profit margin expanded to 8.62%, up from 5.06% in the prior quarter.
- Free Cash Flow Surge: FCF per share grew 473% year-over-year, reflecting strong operational efficiency.
- Analyst Upgrades: EPS and revenue estimates for next year have been revised upward by 8.57% over the past three months.
Technical Report Summary
The ChartMill Technical Report rates NTNX at 10/10, highlighting:
- Strong long-term uptrend with short-term consolidation.
- Support levels at $64.62 and $57.40, providing downside protection.
- Resistance near $82.77-$83.07, marking the next potential breakout zone.
- High liquidity, with average daily volume of 2.69M shares.
Our High Growth Momentum + Trend Template screener lists more stocks with similar growth and momentum characteristics.
Disclaimer
This is not investment advice. The observations are based on current data, but investors should conduct their own analysis before making decisions.