
Uncover the potential of NETEASE INC-ADR (NASDAQ:NTES) as our stock screener's choice for an undervalued stock. NTES maintains a strong financial position and offers an appealing valuation. We'll delve into the specifics below.
Understanding NTES's Valuation Score
ChartMill assigns a Valuation Rating to every stock. This score ranges from 0 to 10 and evaluates the different valuation aspects and compares the price to earnings and cash flows, while taking into account profitability and growth. NTES scores a 7 out of 10:
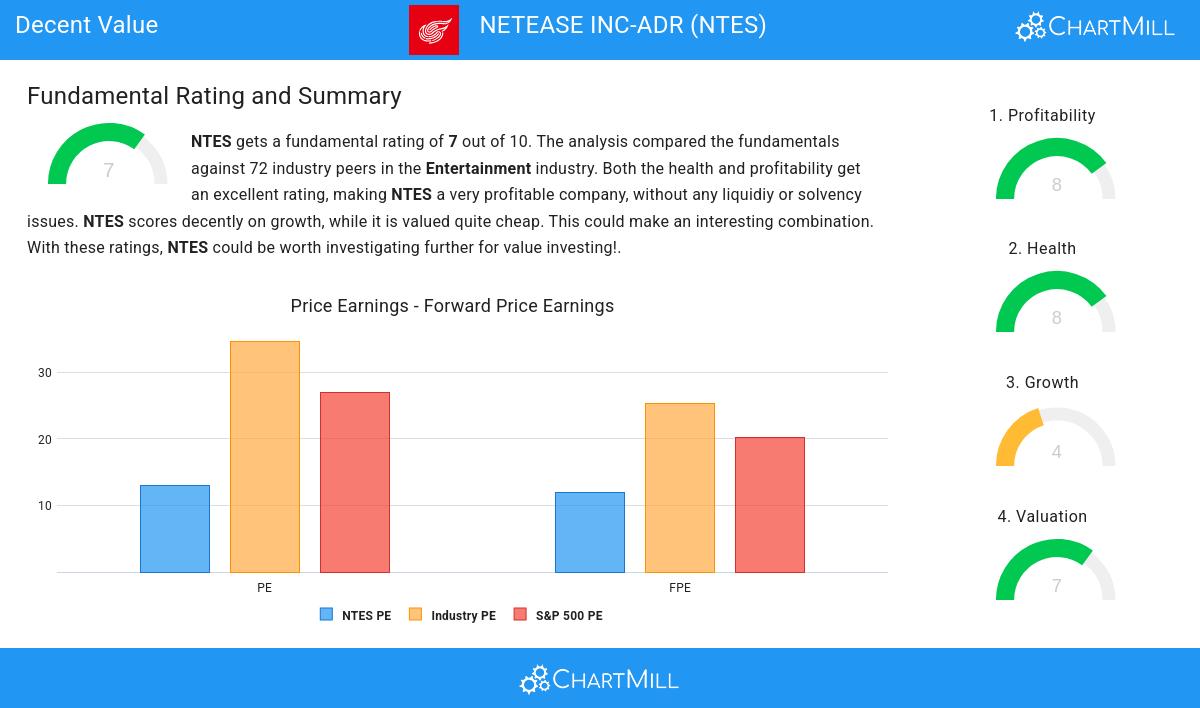
- NTES's Price/Earnings ratio is rather cheap when compared to the industry. NTES is cheaper than 87.50% of the companies in the same industry.
- The average S&P500 Price/Earnings ratio is at 26.98. NTES is valued rather cheaply when compared to this.
- A Price/Forward Earnings ratio of 11.91 indicates a reasonable valuation of NTES.
- Compared to the rest of the industry, the Price/Forward Earnings ratio of NTES indicates a rather cheap valuation: NTES is cheaper than 90.28% of the companies listed in the same industry.
- NTES's Price/Forward Earnings ratio indicates a valuation a bit cheaper than the S&P500 average which is at 20.19.
- NTES's Enterprise Value to EBITDA ratio is rather cheap when compared to the industry. NTES is cheaper than 81.94% of the companies in the same industry.
- Based on the Price/Free Cash Flow ratio, NTES is valued a bit cheaper than the industry average as 79.17% of the companies are valued more expensively.
- The excellent profitability rating of NTES may justify a higher PE ratio.
Profitability Analysis for NTES
ChartMill assigns a proprietary Profitability Rating to each stock. The score is computed by evaluating various profitability ratios and margins and ranges from 0 to 10. NTES was assigned a score of 8 for profitability:
- NTES's Return On Assets of 15.15% is amongst the best of the industry. NTES outperforms 95.83% of its industry peers.
- NTES has a better Return On Equity (21.41%) than 90.28% of its industry peers.
- Looking at the Return On Invested Capital, with a value of 15.99%, NTES belongs to the top of the industry, outperforming 95.83% of the companies in the same industry.
- The last Return On Invested Capital (15.99%) for NTES is above the 3 year average (14.54%), which is a sign of increasing profitability.
- NTES's Profit Margin of 28.20% is amongst the best of the industry. NTES outperforms 97.22% of its industry peers.
- With an excellent Operating Margin value of 28.10%, NTES belongs to the best of the industry, outperforming 98.61% of the companies in the same industry.
- In the last couple of years the Operating Margin of NTES has grown nicely.
- NTES has a Gross Margin of 62.50%. This is in the better half of the industry: NTES outperforms 70.83% of its industry peers.
- NTES's Gross Margin has improved in the last couple of years.
Unpacking NTES's Health Rating
A critical element of ChartMill's stock evaluation is the Health Rating, which spans from 0 to 10. This rating considers multiple health factors, including liquidity and solvency, both in absolute terms and relative to industry peers. NTES has received a 8 out of 10:
- NTES has a debt to FCF ratio of 0.33. This is a very positive value and a sign of high solvency as it would only need 0.33 years to pay back of all of its debts.
- Looking at the Debt to FCF ratio, with a value of 0.33, NTES belongs to the top of the industry, outperforming 90.28% of the companies in the same industry.
- A Debt/Equity ratio of 0.09 indicates that NTES is not too dependend on debt financing.
- NTES has a better Debt to Equity ratio (0.09) than 72.22% of its industry peers.
- A Current Ratio of 3.09 indicates that NTES has no problem at all paying its short term obligations.
- Looking at the Current ratio, with a value of 3.09, NTES belongs to the top of the industry, outperforming 87.50% of the companies in the same industry.
- NTES has a Quick Ratio of 3.08. This indicates that NTES is financially healthy and has no problem in meeting its short term obligations.
- With an excellent Quick ratio value of 3.08, NTES belongs to the best of the industry, outperforming 87.50% of the companies in the same industry.
ChartMill's Evaluation of Growth
ChartMill assigns a Growth Rating to each stock, ranging from 0 to 10. This rating is determined by analyzing different growth elements, including EPS and revenue growth, spanning both historical and future figures. In the case of NTES, the assigned 4 reflects its growth potential:
- NTES shows quite a strong growth in Earnings Per Share. Measured over the last years, the EPS has been growing by 17.51% yearly.
- Measured over the past years, NTES shows a quite strong growth in Revenue. The Revenue has been growing by 12.19% on average per year.
- NTES is expected to show quite a strong growth in Revenue. In the coming years, the Revenue will grow by 9.55% yearly.
Every day, new Decent Value stocks can be found on ChartMill in our Decent Value screener.
Our latest full fundamental report of NTES contains the most current fundamental analsysis.
Keep in mind
This is not investing advice! The article highlights some of the observations at the time of writing, but you should always make your own analysis and invest based on your own insights.