
NETEASE INC-ADR (NASDAQ:NTES) was identified as a decent value stock by our stock screener. NTES scores well on profitability, solvency and liquidity. At the same time it seems to be priced very reasonably. We'll explore this a bit deeper below.
Valuation Assessment of NTES
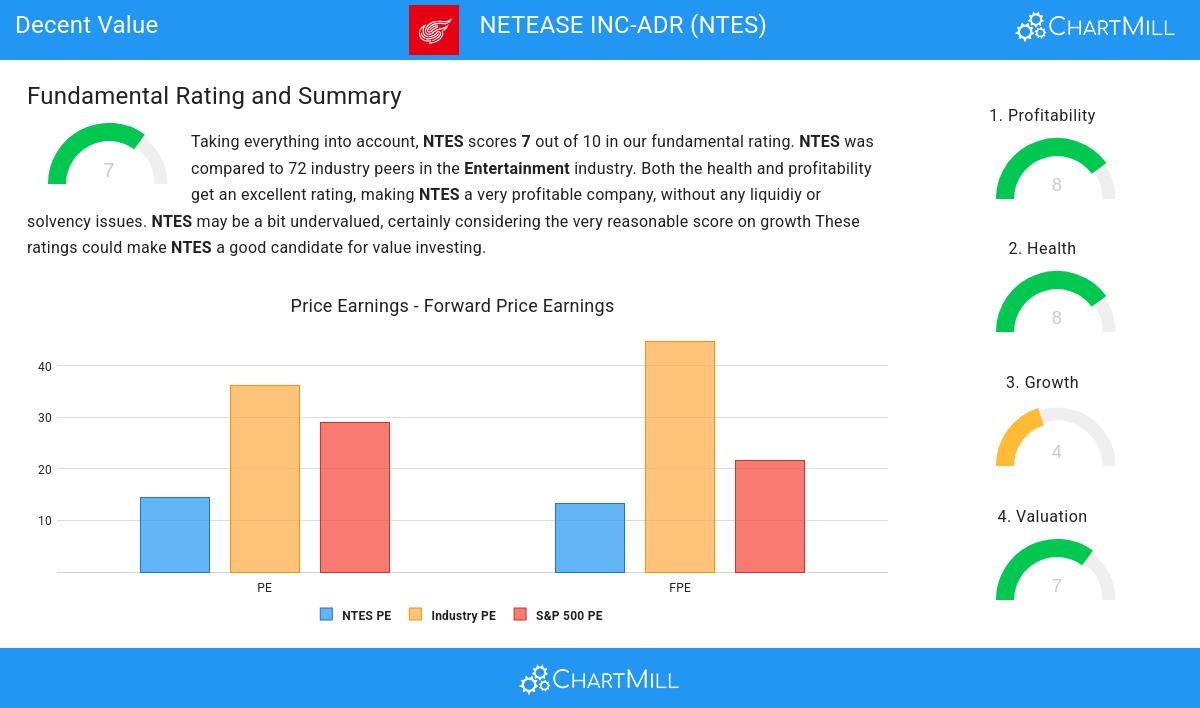
ChartMill assigns a Valuation Rating to every stock. This score ranges from 0 to 10 and evaluates the different valuation aspects and compares the price to earnings and cash flows, while taking into account profitability and growth. NTES scores a 7 out of 10:
- 86.11% of the companies in the same industry are more expensive than NTES, based on the Price/Earnings ratio.
- Compared to an average S&P500 Price/Earnings ratio of 28.90, NTES is valued rather cheaply.
- Compared to the rest of the industry, the Price/Forward Earnings ratio of NTES indicates a rather cheap valuation: NTES is cheaper than 87.50% of the companies listed in the same industry.
- The average S&P500 Price/Forward Earnings ratio is at 21.58. NTES is valued slightly cheaper when compared to this.
- Compared to the rest of the industry, the Enterprise Value to EBITDA ratio of NTES indicates a rather cheap valuation: NTES is cheaper than 80.56% of the companies listed in the same industry.
- Based on the Price/Free Cash Flow ratio, NTES is valued cheaper than 80.56% of the companies in the same industry.
- The excellent profitability rating of NTES may justify a higher PE ratio.
Understanding NTES's Profitability
ChartMill assigns a proprietary Profitability Rating to each stock. The score is computed by evaluating various profitability ratios and margins and ranges from 0 to 10. NTES was assigned a score of 8 for profitability:
- The Return On Assets of NTES (15.15%) is better than 94.44% of its industry peers.
- With an excellent Return On Equity value of 21.41%, NTES belongs to the best of the industry, outperforming 88.89% of the companies in the same industry.
- NTES's Return On Invested Capital of 15.99% is amongst the best of the industry. NTES outperforms 95.83% of its industry peers.
- The last Return On Invested Capital (15.99%) for NTES is above the 3 year average (14.54%), which is a sign of increasing profitability.
- NTES has a better Profit Margin (28.20%) than 95.83% of its industry peers.
- Looking at the Operating Margin, with a value of 28.10%, NTES belongs to the top of the industry, outperforming 98.61% of the companies in the same industry.
- In the last couple of years the Operating Margin of NTES has grown nicely.
- NTES's Gross Margin of 62.50% is fine compared to the rest of the industry. NTES outperforms 72.22% of its industry peers.
- NTES's Gross Margin has improved in the last couple of years.
Health Assessment of NTES
ChartMill utilizes a Health Rating to assess stocks, scoring them on a scale of 0 to 10. This rating takes into account a variety of liquidity and solvency ratios, both in absolute terms and in comparison to industry peers. NTES has earned a 8 out of 10:
- The Debt to FCF ratio of NTES is 0.33, which is an excellent value as it means it would take NTES, only 0.33 years of fcf income to pay off all of its debts.
- NTES has a Debt to FCF ratio of 0.33. This is amongst the best in the industry. NTES outperforms 88.89% of its industry peers.
- A Debt/Equity ratio of 0.09 indicates that NTES is not too dependend on debt financing.
- NTES has a better Debt to Equity ratio (0.09) than 73.61% of its industry peers.
- A Current Ratio of 3.09 indicates that NTES has no problem at all paying its short term obligations.
- Looking at the Current ratio, with a value of 3.09, NTES belongs to the top of the industry, outperforming 86.11% of the companies in the same industry.
- A Quick Ratio of 3.08 indicates that NTES has no problem at all paying its short term obligations.
- NTES has a Quick ratio of 3.08. This is amongst the best in the industry. NTES outperforms 86.11% of its industry peers.
Growth Assessment of NTES
A key component of ChartMill's stock assessment is the Growth Rating, which spans from 0 to 10. This rating evaluates diverse growth factors, such as EPS and revenue growth, considering both past performance and future projections. NTES has received a 4 out of 10:
- NTES shows quite a strong growth in Earnings Per Share. Measured over the last years, the EPS has been growing by 17.51% yearly.
- Measured over the past years, NTES shows a quite strong growth in Revenue. The Revenue has been growing by 12.19% on average per year.
- The Revenue is expected to grow by 9.33% on average over the next years. This is quite good.
Every day, new Decent Value stocks can be found on ChartMill in our Decent Value screener.
Check the latest full fundamental report of NTES for a complete fundamental analysis.
Keep in mind
This is not investing advice! The article highlights some of the observations at the time of writing, but you should always make your own analysis and invest based on your own insights.