
For investors looking to create passive income from their portfolios, a disciplined selection process is important. One useful technique is to concentrate on companies that provide an appealing dividend now and also have the fundamental financial soundness to maintain and possibly increase those payments in the future. A solid selection method, because of this, considers more than just yield, adding checks for earnings power and balance sheet condition to find durable dividend payers. This method helps sidestep the frequent error of high yields that can signal a falling stock price and payments that may not last.
NETAPP INC (NASDAQ:NTAP), a prominent provider in hybrid cloud data services and storage management, appears as a candidate from this kind of selection process. By using checks for a high ChartMill Dividend Rating together with good scores for earnings power and balance sheet condition, the selection finds companies made for endurance in an income portfolio. We will look at why NetApp fits these standards and what it provides to investors focused on dividends.
A Solid Base in Earnings Power
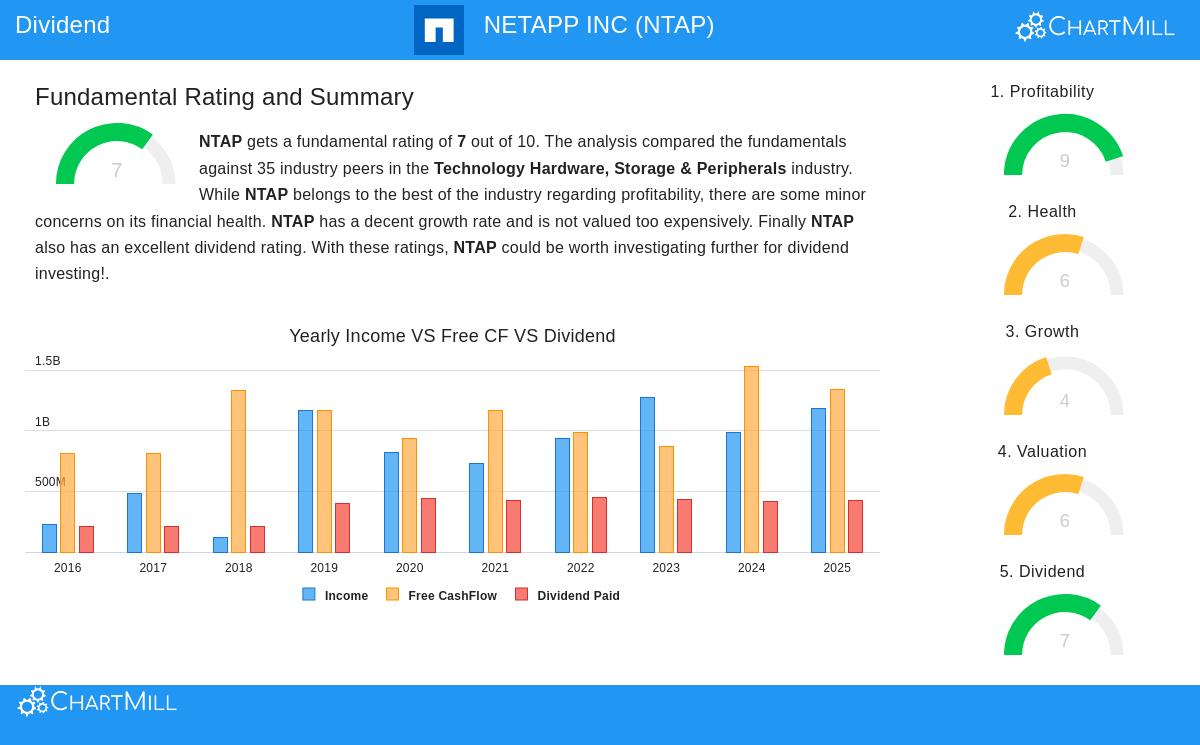
The foundation of any lasting dividend is a company's skill to produce earnings reliably. NetApp is strong here, receiving a top ChartMill Profitability Rating of 9 out of 10. This grade signals outstanding efficiency and earning ability, which directly backs its capability to finance shareholder returns.
Important earnings measures supporting this grade involve:
- High Returns: The company shows very good capital use with a Return on Equity (ROE) of 119.37% and a Return on Invested Capital (ROIC) of 19.95%, both numbers placed in the highest group of its industry.
- Good Margins: NetApp keeps solid profit margins, with an Operating Margin of 22.60% and a Profit Margin of 17.73%. Significantly, these margins have gotten better in recent years, showing positive business trend.
- Steady Earnings: The company has reported profits with positive cash flow from operations in every one of the last five years, supplying a steady source of capital for dividends and business investment.
This solid earnings power is essential for dividend continuity, as it confirms the company is not paying shareholders from debt or shrinking cash holdings.
Reviewing the Dividend Offering
NetApp gets a good ChartMill Dividend Rating of 7, pointing to a well-backed and dependable income payment. This grade combines a number of important elements for dividend investors.
Yield and Increase: The stock provides a dividend yield near 1.92%, which is comparable inside the Technology Hardware field and matches the wider S&P 500 average. While the yearly dividend increase rate has been small at about 1.72% over the past five years, the steadiness is significant. NetApp has built a dependable history, having paid and not reduced its dividend for more than ten years.
Dividend Safety: This is where NetApp's financial statements give important assurance. The payout ratio—the part of earnings paid as dividends—is at a very comfortable 35.51%. This low ratio is a central sign of security; it means the company keeps most of its earnings to put back into the business, reduce debt, or manage economic slowdowns without quick need to lower the dividend. Also, analyst forecasts for earnings growth are higher than the dividend growth rate, implying the present payment level is very secure.
Reviewing Balance Sheet Condition
A company's balance sheet condition decides its skill to face difficulties without threatening its dividend. NetApp's ChartMill Health Rating of 6 shows a mostly stable but varied situation, with definite positives and points to watch.
On the good side, the company displays high ability to meet obligations. Its debt compared to free cash flow is very low at 1.48, meaning it could pay off all its debt in under a year and a half using its present cash flow—a condition better than most industry competitors. However, the balance sheet holds a somewhat high Debt-to-Equity ratio. It is useful to understand this: the rating report states that even with the higher ratio, NetApp's total debt amount is controlled, and its good cash production lessens the connected risk.
Valuation Setting
For dividend investors intending to own for the long term, buying at a sensible price is useful. NetApp seems priced fairly, trading at a P/E ratio near 14, which is lower than both the S&P 500 average and most of its industry competitors. Other price measures, like Price/Free Cash Flow and Enterprise Value/EBITDA, also indicate the stock is valued somewhat low inside its field. This price, joined with its high earnings power, suggests investors are not paying too much for the company's profit generation or its dividend.
A Candidate for a Steady Dividend Portfolio
NetApp makes a strong argument for investors using an earnings-focused dividend selection technique. It is not a high-yield selection, but instead one of dependability and safety, supported by very good earnings power, a very secure payout ratio, and a ten-year record of commitment to shareholders. The company’s good cash flow production gives a cushion for its dividend, even as it manages the investment needs of the active cloud infrastructure market.
For investors whose method values lasting income over highest yield, NetApp stands as a candidate deserving more examination. Its mix of financial soundness, shareholder commitment, and fair price matches the ideas of creating a durable dividend portfolio.
Interested in reviewing other stocks that meet similar earnings dividend checks? You can use the "Best Dividend Stocks" selection yourself to view the complete list of candidates here.
Disclaimer: This article is for informational purposes only and does not constitute financial advice, a recommendation, or an offer to buy or sell any security. Investors should conduct their own due diligence and consult with a qualified financial advisor before making any investment decisions. Past performance is not indicative of future results.