![]()
NerdWallet is one of those companies that looks obviously valuable at first glance: a trusted consumer brand, millions of users, and a product that helps people make high-stakes financial decisions. If you could own a “front door” to credit cards, banking, loans, and insurance at scale… that’s a pretty attractive place to be.
But investors have learned the hard way that not all “front doors” are equally sturdy. If a meaningful part of your traffic depends on search algorithms - or if your monetization depends on partners whose budgets rise and fall with lending cycles - you can get hit even when your product is good.
So where does NRDS stand today?
At a most recent close of $13.48, the stock is sitting in the middle of a multi-year range. Fundamentals look better than they did a year ago, but the market still isn’t paying “steady compounder” prices. That gap between what NRDS could be and what NRDS has proven is where the opportunity (and risk) lives.
Below is a deep dive aimed at growth investors who understand fundamentals but want a clear, plain-English framework. I’ll cover:
-
What the business really is (and what it is not)
-
What the quarterly results since 2023 are telling us
-
The most important signals from the shareholder letters
-
A bear, neutral, and bull case
-
A practical earnings checklist for next quarter
-
My conclusion: Is this a buy at $13.48?
The simple NerdWallet model: traffic → trust → conversion → reinvestment
In plain terms, NerdWallet does two things:
- Attracts consumers who are researching financial decisions (cards, loans, insurance, banking, investing)
- Monetizes that intent by matching consumers to partner offers (think lead gen / marketplace economics)
The long-term “compounding dream” looks like this:
-
Build a large audience cheaply (brand, content, tools)
-
Convert that audience more efficiently over time (better UX + data + personalization)
-
Expand into more categories per user (more “lifetime value”)
-
Reinvest cash flow into product + owned relationships (less dependence on any single channel)
-
Repeat...
If you want this to become a true long-term winner, you’re basically underwriting one idea:
Can NerdWallet turn a big audience into an “owned relationship” engine that gets more valuable every year, with rising margins and rising free cash flow?
What the quarterly numbers since 2023 say (without overcomplicating it)
When you scan the results since 2023, three themes jump out.
1. Revenue is not a straight line
There are periods of softness and periods of sharp re-acceleration. That volatility matters because markets pay up for consistency. Even if the long-term trend is fine, uneven execution often leads to a “range-bound” stock.
2) The business has real operating leverage
In the stronger quarters, NerdWallet demonstrates what you want from an asset-light platform: revenue growth shows up meaningfully in profits.
A standout example is 2025 Q3, where they posted:
-
~$215M revenue
-
~$54M adjusted EBITDA (about 25% margin)
-
~$41M non-GAAP operating income (about 19% margin)
That’s the good version of this company: when demand and distribution cooperate, NerdWallet throws off real profit.
3) Cash generation is becoming harder to ignore
In the 2025 shareholder letters, management highlights improving trailing adjusted free cash flow and increasing cash balances. For long-term growth investors, this matters because it signals a transition: from “we’re building” to “we’re building and funding it internally”.
That is how you eventually get compounder behavior.
The shareholder letter pivot: from “traffic” to “relationships”
One of the most important strategic tells: management gradually moved away from emphasizing “raw audience” metrics (like monthly unique users) and toward deeper relationship measures such as registered users and engagement quality.
You can interpret that in two ways:
-
Positive interpretation: They’re focusing on what actually drives durable value, not vanity traffic.
-
Cynical interpretation: They’re de-emphasizing a metric because the SEO environment made it harder to show consistent growth.
Either way, it points to the same truth:
The next phase of the NRDS story is about owning the customer relationship so the business is less fragile.
That’s the difference between a company that can compound quietly for a decade and a company that lives quarter-to-quarter on external factors.
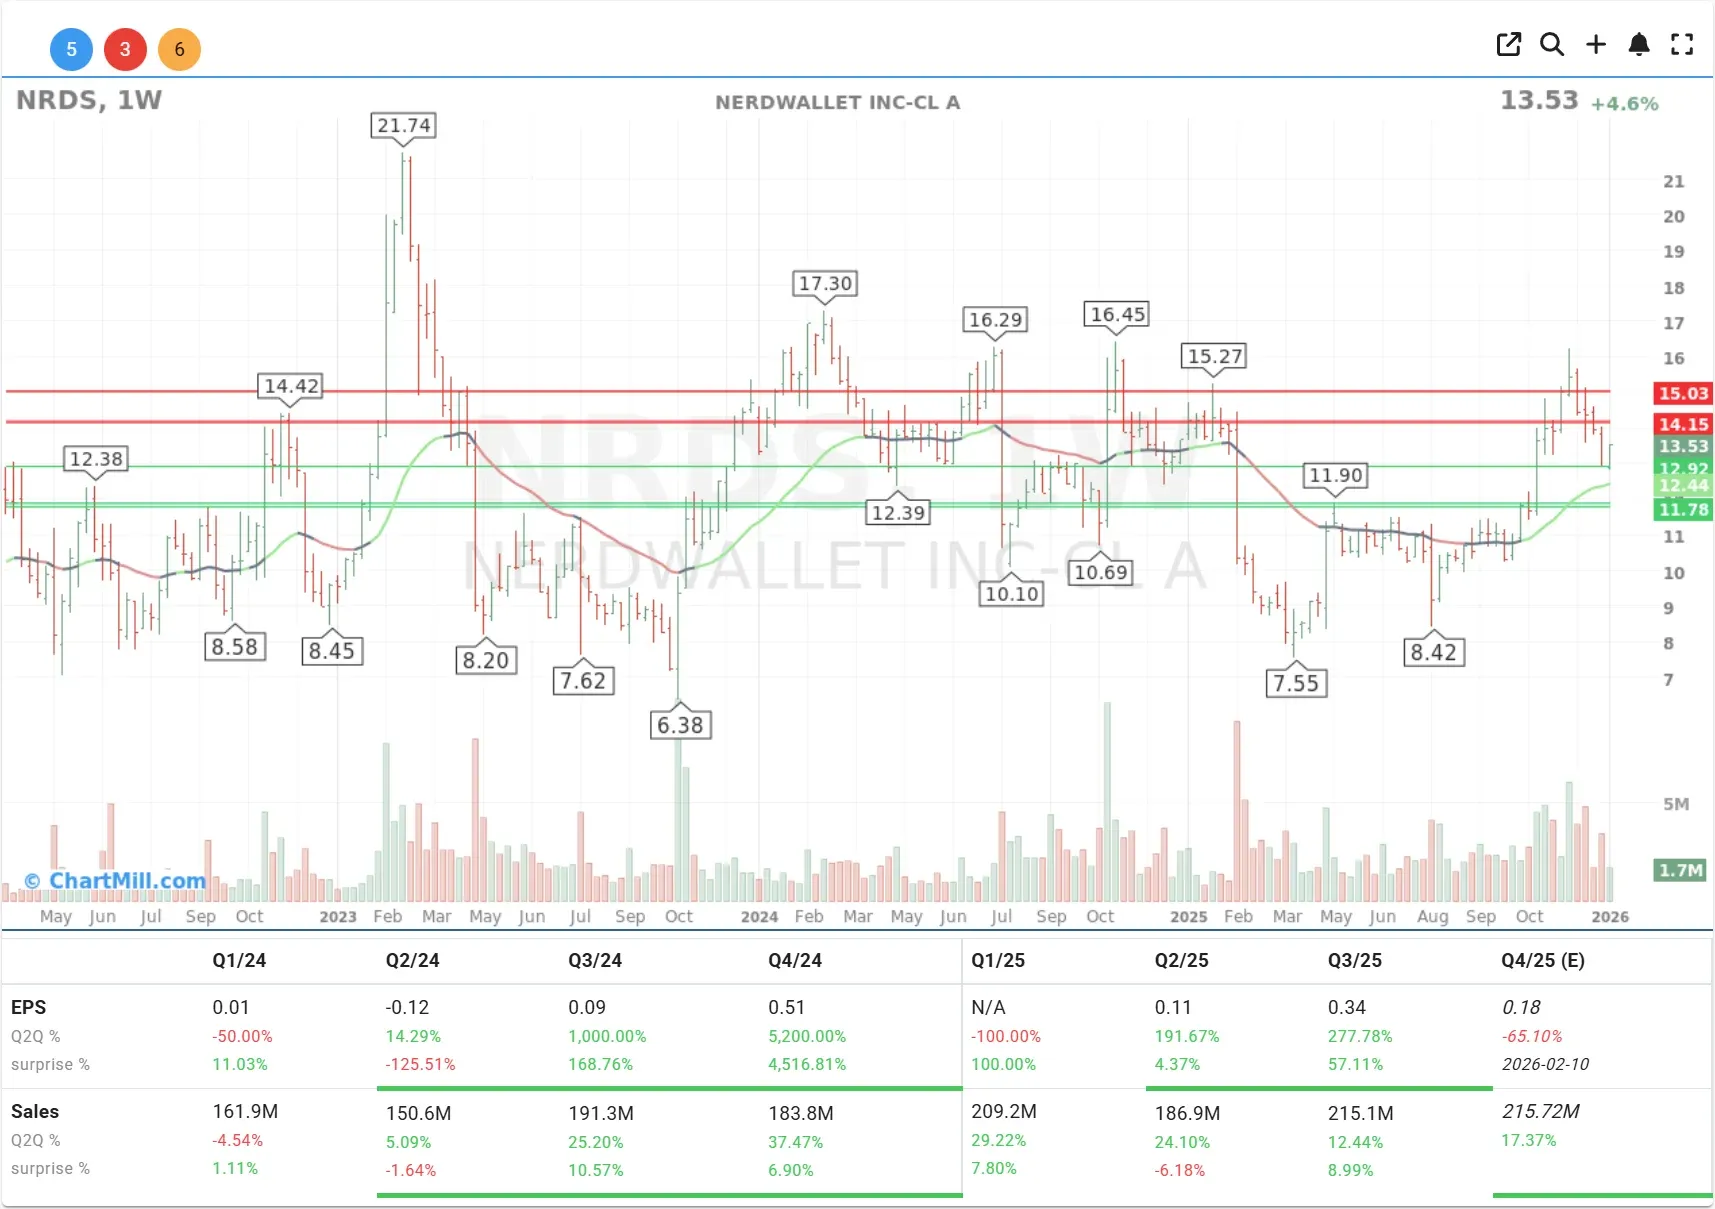
What the weekly chart is saying at $13.48
Your weekly chart reinforces the same “prove it” narrative.
-
There’s a clear resistance zone around ~$15. The stock has struggled to hold above that level multiple times.
-
There’s a notable support band around ~$12–$12.50, where buyers have tended to show up.
-
The price is constructive (higher than the lows), but it’s still below the area where the market would be forced to admit, “okay, something has changed.”
Translation: fundamentals have improved, but the market wants proof of durability before rerating the stock.
The three investment cases
Bear case: “Good brand, but structurally dependent”
In the bear case, NerdWallet never fully escapes two big dependencies:
-
Platform risk (search algorithms / traffic volatility)
-
Partner/cycle risk (budgets and conversion tied to credit/mortgage/insurance cycles)
If those remain dominant, then even if NRDS posts occasional strong quarters, investors keep discounting the model.
What the bear case looks like financially
-
Growth remains inconsistent
-
Margins swing sharply
-
The stock stays range-bound and cheap-looking for years
Bear-case red flags
-
A return to revenue declines or weak guidance tied to traffic
-
Conversion and monetization pressure (partners paying less, weaker demand)
-
Cost growth needed just to “stand still” (less operating leverage)
Neutral case: “Solid platform business, modest rerating”
In the neutral case, the business progresses, just not explosively.
-
Revenue grows mid-single digits to low double digits over time
-
Profitability improves, but not in a clean upward trend
-
Free cash flow improves gradually
-
The market assigns a reasonable valuation but doesn’t treat it like a “must-own compounder”
This is the “good company, okay stock” scenario: respectable returns, but you don’t get a big multiple expansion tailwind.
Bull case: “Owned distribution + higher LTV = real compounding”
The bull case is what makes NRDS interesting at all for a growth investor.
Here, NerdWallet becomes less traffic-dependent and more relationship-driven:
-
Registered users become the core asset (repeat behavior, personalization)
-
The company increases products-per-user and lifetime value
-
Operating leverage becomes more consistent
-
Free cash flow grows meaningfully
-
The market rerates NRDS as a durable platform rather than a cyclical marketing asset
Bull-case signals
-
Stable to rising margins even in normal quarters
-
Continued improvement in cash generation
-
Evidence that owned channels (direct/app/email) matter more each quarter
-
More consistent performance across verticals (not just one category carrying results)
The “What must be true” framework (my favorite way to track this story)
If you’re researching NRDS like a potential long-term compounder, the thesis isn’t complicated. You just need to watch the right variables.
-
Durability improves; Owned relationships increasingly drive outcomes (not just traffic).
-
Monetization per user improves; Better conversion, better partner economics, higher lifetime value.
-
Margins trend upward over time; Not perfectly, but the “floor” rises.
-
Cash flow scales; More cash gives the company strategic freedom: invest, buy back, or acquire.
If you don’t see these improving over a year or two, the stock can easily remain a range-trader.
Earnings checklist for next quarter
When NRDS reports next quarter, here are the few things that actually matter for the long-term thesis:
Growth quality
-
Revenue growth vs prior quarters (accelerating, stable, or fading?)
-
Any commentary on partner demand and conversion environment
-
Category mix: are multiple verticals contributing?
Durability of distribution
-
Indicators that owned relationships are expanding in importance
-
Registered user growth and engagement/retention proxies they choose to highlight
-
Any direct commentary on organic traffic / search environment and mitigation
Margin + operating leverage
-
Adjusted EBITDA margin (does it hold up or revert?)
-
Non-GAAP operating margin trend
-
Operating expense discipline: are they investing and staying efficient?
Cash and capital allocation
-
Free cash flow (quarter and trailing)
-
Cash balance trend
-
Share count trend (dilution vs buybacks)
-
Any M&A updates (especially deals that increase control of the funnel)
Guidance
-
Revenue outlook changes
-
Profitability/cash flow outlook changes
-
Tone: confidence vs caution (often the true market mover)
Conclusion: Is NRDS a buy right now?
At the current price level, NerdWallet looks like a company that’s starting to behave more like an asset-light platform with real operating leverage, but it hasn’t fully earned the market’s trust as a durable compounder yet.
I’m constructive enough to want exposure here, because the ingredients are becoming visible:
-
strong brand in consumer finance,
-
improving profitability in stronger quarters,
-
and rising cash generation that creates strategic flexibility.
But I’m also realistic about what still needs to be proven:
-
the business must keep shifting toward owned relationships (registered users, repeat engagement, direct/app/email),
-
and it must show that margins and cash flow can stay resilient even when the external environment isn’t perfect.
The position plan (for a $100,000 portfolio)
I would start with a 3% position. That’s about $3,000 at today’s price of $13.48, or roughly 222–223 shares.
From there, I’d only add if future earnings reports confirm the story (using the checklist above).
How I’d handle it
Instead of trying to “perfect” the entry price, I’d take that 3% starter position and let future quarterly results determine whether it deserves more capital.
The playbook is straightforward:
-
Start small today (3%).
-
Add only if the next earnings reports confirm the story (using the checklist below).
-
Cut exposure if the thesis breakers show up (traffic fragility returning, guide-downs tied to platform shifts, margin collapse, or weakening cash conversion).
Bottom line:
At ~$13.50, I’d treat NRDS as an early-stage compounder candidate worth owning in a small size and I’d let execution over the next few quarters decide whether it graduates into a full position.
How I found NerdWallet (NRDS) with the ChartMill stock screener
When I go looking for “potential multibaggers,” I don’t start with headlines or social media tickers. I start with a repeatable screening process that forces me to focus on the two things that matter most early on:
-
Is this a financially healthy business?
-
Is there evidence of real growth?
That’s exactly how NerdWallet (NRDS) ended up on my radar.
The exact ChartMill filter set I used
In ChartMill, I ran a very simple “high-quality small-cap growth” screen:
-
Price > $3 (avoid ultra-low priced stocks)
-
US only
-
Market cap < $1B (small enough to still have runway)
-
ChartMill Health Rating ≥ 7/10 (proprietary financial health filter)
-
ChartMill Valuation Rating ≥ 5/10 (proprietary “not outrageously priced” filter)
-
5Y Revenue Growth ≥ 20% (real historical growth, not a story)
That screen returned just 16 stocks.
And that’s the point.
Instead of drowning in hundreds of names, I get a short, researchable list of companies that already cleared a few important hurdles:
-
they’re not financially weak,
-
they’re not gigantic already,
-
and they’ve demonstrated meaningful top-line growth over time.
Why these filters matter
A lot of investors think “multibagger hunting” is about finding the most exciting story. I see it differently: it’s about finding companies that can compound for years.
This screen is designed to tilt the odds in that direction:
-
Health Rating ≥ 7/10 is my first line of defense against fragile balance sheets, poor profitability profiles, and low-quality fundamentals. In multibagger terms: I want a business that can survive and reinvest, not one that constantly needs fresh capital.
-
Valuation Rating ≥ 5/10 keeps me away from the most crowded “priced for perfection” names. It doesn’t mean the stock is cheap, it simply reduces the risk that I’m paying any price for growth.
-
Market cap < $1B is the “runway” filter. A company can still become a big winner from a mid-cap level, but small caps typically have a much larger surface area for growth.
-
5Y revenue growth ≥ 20% ensures this isn’t purely a turnaround hope. It’s a sign that the company has already proven it can expand its business over time.
The screener gives me candidates, the deep dive decides the investment
This part is crucial: a screener doesn’t tell me what to buy. It tells me what deserves attention.
NRDS passed the screen, but the real work started after that:
-
reading quarterly results and shareholder letters,
-
checking whether growth quality is improving,
-
and judging whether the company is becoming more durable (less dependent on external traffic/platform shifts)
So the workflow is always the same:
Screen → shortlist → deep dive → earnings checklist → decision
That’s how NerdWallet made it from “one of 16 names” to a full research write-up.
Wanna try it yourself? This is the direct link to above screen.
Small position, big checklist, and we’ll let the next few earnings reports do the talking!
Kristoff - ChartMill