
In the world of growth investing, combining a strict technical framework with a focus on fundamental momentum can be an effective method for spotting possible leaders. One example is the Mark Minervini strategy, which brings together his specific Trend Template with a detailed study of earnings and sales acceleration. The objective is to locate stocks that are both in a solid, confirmed uptrend and supported by companies showing strong fundamental growth. This two-step method tries to select securities that have the technical condition and the fundamental driver to maintain a large price increase.
A recent filter made to find these chances has identified NPK International Inc (NYSE:NPKI) as a candidate for more review. The filter uses Minervini's Trend Template to verify a stock is in a definite bullish period, while also needing a minimum "High Growth Momentum" score to select for companies with good and improving financial results.
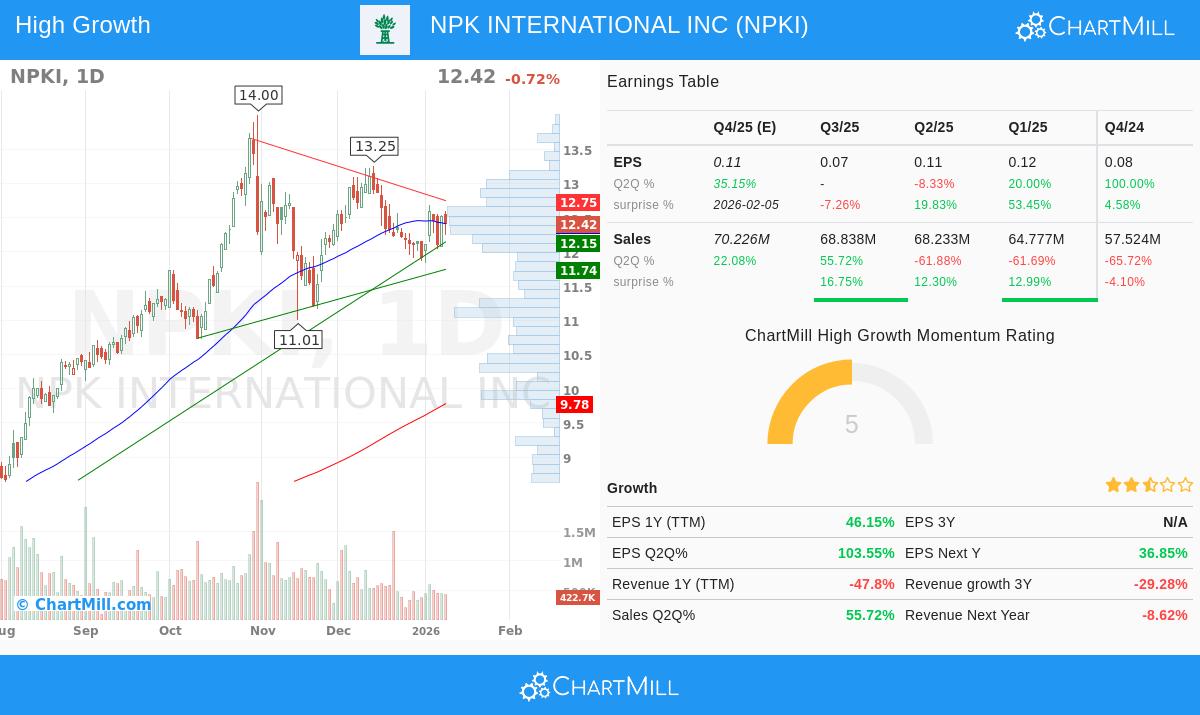
Reviewing the Trend Template Match
Mark Minervini's Trend Template is a group of fixed technical rules made to spot stocks in a solid Stage 2 advance. It confirms an investor is purchasing into strength, not trying to buy a declining stock. For NPKI, a check of the main points shows a mostly good situation:
- Moving Average Arrangement: The stock's price is now above its rising 50-day, 150-day, and 200-day simple moving averages (SMAs). This ordered arrangement is a typical indicator of a sound uptrend across several timeframes.
- Nearness to Highs: A central idea of the method is to concentrate on strength. NPKI's present price is situated within 25% of its 52-week high, showing it is behaving like a market leader. Also, it trades more than 30% above its 52-week low, confirming a notable upward trend is already established.
- Relative Strength: Possibly most notable is NPKI's relative strength (RS) ranking of 91.11. This indicates the stock is doing better than over 91% of the market, a key filter Minervini stresses to ensure one is investing in actual sector leaders.
These technical elements together imply NPKI is in a positive state, satisfying the systematic list that aims to reduce risk by joining confirmed uptrends.
Checking the High Growth Momentum Data
While the Trend Template deals with the "when" to buy, the "what" to buy is decided by fundamental momentum. The High Growth Momentum score searches for proof of improving business results, which frequently comes before or along with large stock price gains. NPKI's recent financial numbers display several encouraging indicators of this momentum:
- Earnings Performance: The company's latest quarterly earnings per share (EPS) rose over 103% against the same quarter last year. This type of strong year-over-year growth is precisely what growth investors and methods like Minervini's SEPA (Specific Entry Point Analysis) look for, as it can work as a trigger for institutional purchasing.
- Estimate Results: NPKI has a solid history of surpassing forecasts, beating EPS estimates in three of the last four quarters by an average of almost 18%. Repeated positive surprises can strengthen investor trust and lead to higher changes in future estimates.
- Future Estimate Changes: Analysts have raised their revenue estimates for the coming year by about 5.85% over the past three months. Increasing estimates often show better business clarity and can give support for the stock price.
However, a fair view needs noting conflicting signals. While quarterly sales growth was strong at over 55%, yearly revenue patterns are more difficult, and recent profit margins have reduced from earlier quarters. This highlights the value of the filter's momentum score, which probably balances these items to reach its evaluation, indicating the positive growth forces are now primary.
Technical Pattern and Formation Chance
Apart from the basic rules, the stock's present chart pattern gives a clear chance. Based on ChartMill's specific study, NPKI shows a technical formation worth watching. The stock has been moving in a range over the last month, letting its moving averages move closer and possibly form a base for its next step.
The study notes a defined resistance area just above the present price, near $12.75 to $12.96. A clear move above this point could mark the restart of the longer-term uptrend. On the other hand, a set support area lies below, giving a reasonable place for a protective stop-loss order. This makes a measurable risk/reward situation, which is important for systematic trading.
For a full explanation of the support and resistance points, entry and exit spots, and the total technical score, you can see the complete ChartMill Technical Analysis Report for NPKI.
Conclusion
NPK International Inc appears as a notable example for the joined technical and fundamental filtering method. It shows good match with the momentum-centered ideas of the Minervini Trend Template, especially through its better relative strength, positive moving average arrangement, and place close to 52-week highs. Fundamentally, it shows areas of strong growth, mainly in recent quarterly earnings, which might act as the needed trigger for more price gains.
For investors and traders using this method, NPKI stands for the kind of candidate that justifies a spot on a watchlist. The following action would include watching for a definite move out from its present consolidation, supported by high volume, to verify a new possible entry point in line with the existing trend.
This study of NPKI came from a specific filter for high-growth momentum stocks inside a solid technical trend. To see other securities that now fit these particular rules, you can use the High Growth Momentum + Trend Template screen on ChartMill.
Disclaimer: This article is for informational and educational purposes only. It is not intended as investment advice, a recommendation, or an offer to buy or sell any security. The analysis is based on data provided and certain filtering methods, which have inherent limits. You should do your own complete research, think about your personal financial position, and talk with a qualified financial advisor before making any investment decisions. Past performance is not a guide to future results.