
For investors aiming to join strict technical rules with an emphasis on fundamental growth, the method supported by Mark Minervini offers a strong framework. This process, frequently called the SEPA (Specific Entry Point Analysis) strategy, depends on finding stocks that are already in strong upward moves and are supported by improving business foundations. The aim is not to guess lows but to join the solid, continued advances of market leaders. To put this into practice, traders frequently apply Minervini's Trend Template, a fixed group of technical filters, to confirm a stock is in a definite Stage 2 upward move. This is combined with a review of strong growth momentum, searching for firms showing outstanding profit strength, sales increases, and positive earnings surprises. The combination of a firm technical position and solid fundamental improvement is what marks a top choice within this plan.
A present instance that seems to fit this two-part method is Nelnet Inc. - Class A (NYSE:NNI). The Lincoln, Nebraska-based firm, mainly recognized for loan servicing and education technology, is displaying traits that could draw both trend-based and growth-focused investors.
A Clear Trend Template Position
The base of the Minervini plan is confirming a stock's price movement shows clear force. The Trend Template's rules are made to sort for stocks in sound, set upward moves, and Nelnet's chart presently passes these strict technical tests.
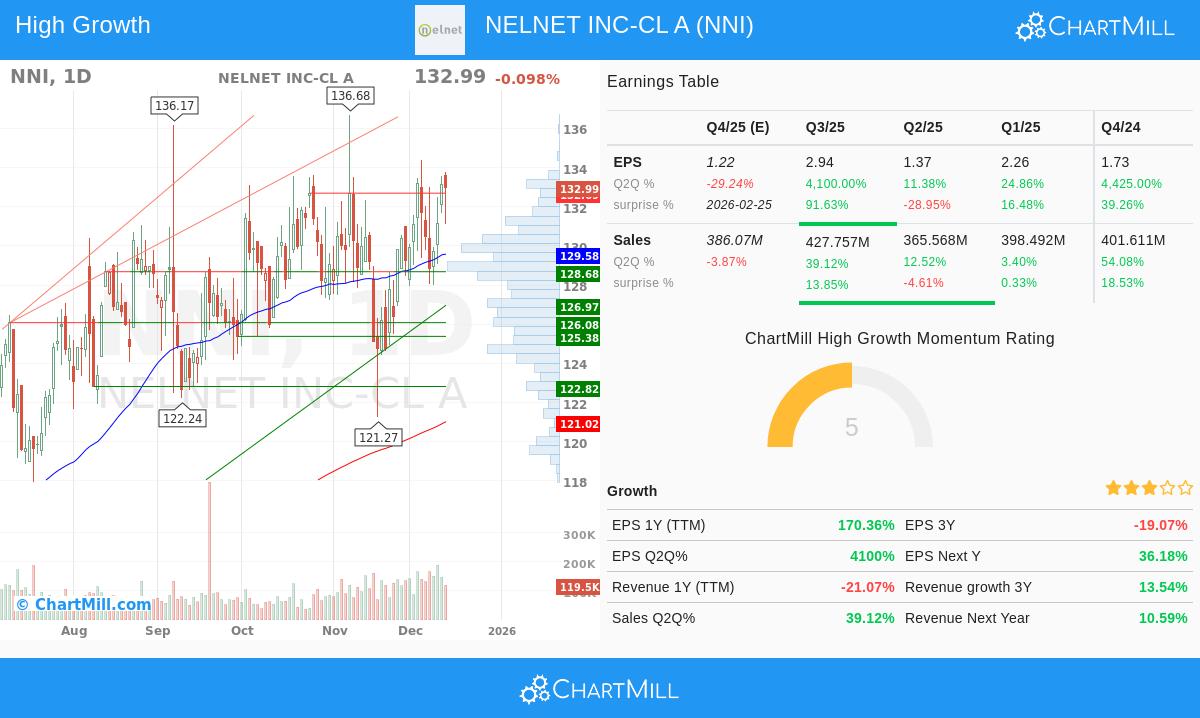
- Price Above Important Moving Averages: NNI's present price trades well above its 50-day ($129.58), 150-day ($124.64), and 200-day ($121.03) simple moving averages (SMAs). This layered agreement shows continued buying interest across short, medium, and long-term periods.
- Upward Moving Average Directions: Importantly, these moving averages are not just price points but are themselves moving upward. The climbing 200-day SMA, a main standard for long-term soundness, verifies the stock is in a bull market stage.
- Firm Momentum Agreement: The 50-day SMA sits above both the 150-day and 200-day SMAs, while the 150-day SMA is above the 200-day. This "ordered" arrangement is a standard sign of increasing momentum and large investor buying.
- Nearness to Highs: NNI is trading within 3% of its 52-week high of $136.68 and rests about 35% above its 52-week low. This meets the template's need to concentrate on force, stocks close to new highs often show leading traits.
- Better Relative Performance: With a ChartMill Relative Strength (CRS) score of 81.2, NNI is doing better than a large part of the wider market. High relative strength is a required feature for Minervini, as it finds stocks that are guiding the market upward, not just joining.
This combination of technical elements indicates NNI is in a verified Stage 2 rise, the exact period where Minervini's study shows the largest gains usually happen.
Examining the Strong Growth Momentum Picture
While the Trend Template confirms a stock is technically correct, the SEPA strategy requires a fundamental driver. The "High Growth Momentum" part looks for firms with forceful and getting better earnings patterns. Nelnet's recent financial numbers show several strong data points.
The most notable numbers are seen in the firm's recent quarterly earnings per share (EPS) increase on a year-over-year basis:
- Most Recent Quarter (Q2Q): +4,100.0%
- Three Quarters Ago (Q2Q Q-3): +4,425.0%
These very high percentages, while partly showing a smaller base in the earlier-year periods, mean a sharp turn in earnings. This jump is further backed by a firm history of exceeding analyst estimates, with positive EPS surprises in three of the last four quarters.
Reviewing yearly performance, the pattern stays firm:
- EPS Growth (TTM): +170.4%
- EPS Growth (Last Full Year): +91.3%
Also, the firm's earnings are growing notably. The profit margin in the last reported quarter was 20.3%, a large gain from 11.1% three quarters before. This growth in margins implies operational effectiveness and pricing control, main features of a fundamentally sound business.
It is significant to state that revenue increase has been varied, with a drop over the trailing twelve months but a firm 39.1% rise in the most recent quarter. This mixed image highlights the value of the Minervini method's individual stock selection, concentrating on the single stock's earnings strength and technical position even when sales growth may be inconsistent.
Technical Soundness and Position Quality
Beyond the basic Trend Template, a more detailed technical review using ChartMill's own scores gives extra detail. NNI receives a highest-level Technical Rating of 10/10, showing outstanding soundness across short and long-term patterns. The stock is also given a Setup Rating of 8/10, meaning it is settling in a fairly narrow band after its rise, which can come before a new upward move. The technical report notes lower price swings and the existence of a "Pocket Pivot" signal, a volume-based sign often linked to large investor buying.
The review finds nearby support close to the $132 level and resistance just above the present price around $133.20. A clear move above this resistance area could be seen as a new entry sign for traders following the plan, with set risk levels below support.
You can examine the complete, detailed technical review for NNI here.
Locating Comparable Possibilities
Nelnet Inc. gives a study in a stock that presently fits the exact technical filters of the Minervini Trend Template while also showing the sharp earnings increase wanted by momentum investors. For those looking to search for similar possibilities that meet this joined standard of technical force and strong-growth foundations, a preset search exists.
Disclaimer: This article is for information and learning only. It is not advice to buy or sell any security. The review is based on present data and a specific investment approach. All investing includes risk, including the possible loss of original funds. You should do your own complete study and think about talking with a qualified financial advisor before making any investment choices. Past results are not a guide for future results.