
For investors who use charts and price action to guide their choices, a methodical process can help sort the market's distractions. One such process involves searching for stocks that are both technically sound and forming a helpful pattern for a possible entry. This method centers on two main proprietary measures: the ChartMill Technical Rating, which judges the general condition and direction of a stock, and the ChartMill Setup Quality Rating, which examines if the stock is resting in a manner that offers a clear, lower-risk trading chance. The aim is to find leading stocks that are resting before their next possible move up.
Annaly Capital Management Inc (NYSE:NLY), a mortgage real estate investment trust (mREIT), recently appeared from such a search, showing a notable mix of these measures. A close look at its technical picture shows why it has drawn the notice of chart-focused investors.
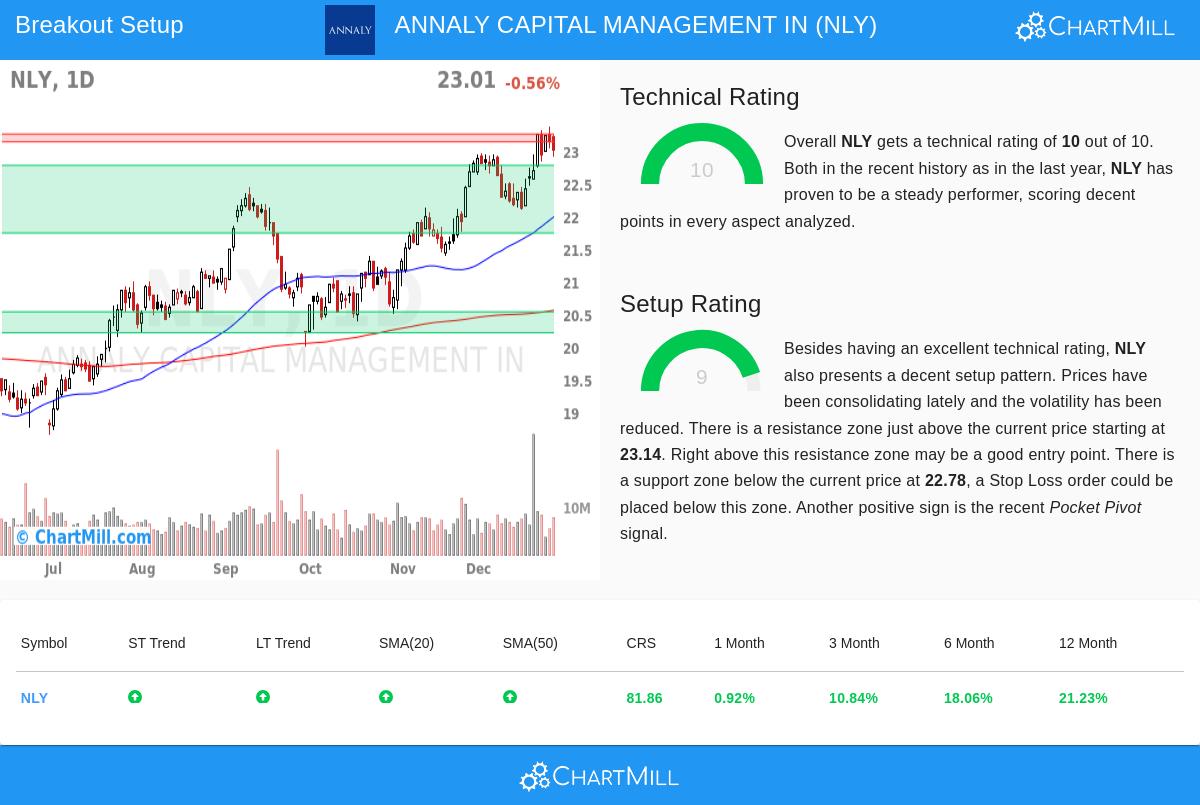
Technical Strength: A Base of Leadership
The main filter in a breakout search is a high Technical Rating, as it confirms the stock is in a definite upward direction and doing better than similar stocks. Annaly Capital Management receives a top score of 10 in this group, putting it with the market's technical leaders. The detailed technical report notes several bases of this soundness:
- Trend Agreement: Both the long-term and short-term directions for NLY are marked as positive. This agreement across different periods points to continued buying interest and lowers the chance of an opposing trend change.
- Peer and Market Superiority: The stock is doing better than 81% of all stocks in the market over the last year. More notably, within the active Mortgage REITs field, it beats 97% of its 68 peers. This comparative performance is a sign of field leadership.
- Supportive Averages: The stock's price is above all its main simple moving averages (20, 50, 100, and 200-day), and each of these averages is itself in a rising pattern. This layered agreement of support points is a standard trait of a sound upward direction.
- Nearness to Highs: NLY is trading close to its 52-week high, which usually shows an absence of available supply from investors wanting to sell at their purchase price. The report states this performance matches the wider S&P 500, which is also near highs, indicating the move is backed by the general market condition.
This solid technical foundation is important for the method because it directs money to assets that are already wanted and showing forward motion, raising the chance that a move out of consolidation will result in more upward movement.
Setup Quality: The Pattern for a Possible Entry
A sound direction by itself is not a sign to buy; entering at a stretched price can result in quick declines. This is where the Setup Quality Rating becomes key, finding times of consolidation or "tight" trading that frequently come before a new directional move. NLY scores a 9 on this measure, pointing to a high-grade setup pattern.
The examination indicates a clear story on the chart:
- Consolidation in an Upward Direction: Over the last month, NLY has been trading in a fairly narrow band between $22.10 and $23.38. This rest comes after a notable upward move and lets the stock ease overbought states while its moving averages draw nearer.
- Specific Support and Resistance: The setup finds a main support area between $21.74 and $22.78, made by a combination of trendlines and moving averages. Just above the present price, a resistance area exists between $23.14 and $23.26. These specific points give clear markers for risk control.
- Lowered Volatility and Positive Signs: The report mentions "lowered volatility while prices have been consolidating," which often comes before a volatility increase,a breakout. Also, a recent "Pocket Pivot" sign was seen, a volume-based pattern that can point to gathering by large investors.
For a technical trader, this setup turns into a specific plan. The examination proposes a possible entry just above the resistance area at $23.27, with a stop-loss order set below the support area around $22.09. This framework intends to enter only if the stock shows it can pass selling pressure at resistance, thus confirming the breakout idea.
Conclusion and More Study
The mix of a top Technical Rating and a high Setup Quality Rating makes Annaly Capital Management a stock of note for investors using a technical breakout method. It shows the hunt for leading stocks that are pausing, possibly preparing for their next rise. Naturally, as an mREIT, the company is affected by interest rate changes and wider financial states, which should be reviewed along with the technical view.
Interested in finding other stocks currently showing similar technical signs? You can use the same search method with the Technical Breakout Setups screen.
,
Disclaimer: This article is for information only and is not investment guidance, a suggestion, or an offer to buy or sell any security. The examination shown is based on technical measures and past data, which are not assurances of future results. Always do your own study and think about your financial position and risk comfort before making any investment choices.