
Technical breakout strategies focus on identifying stocks that are not only in strong upward trends but also consolidating in a manner that hints at a likely continuation of that trend. These setups are especially attractive to traders seeking entry points with clear risk definitions. The method relies on two main metrics: the ChartMill Technical Rating, which measures the overall strength of a stock’s trend, and the ChartMill Setup Quality Rating, which checks if the stock is forming a solid base for a potential breakout.
NIKE INC - CL B (NYSE:NKE) currently meets these conditions, showing both strong technical performance and a high-quality setup. The stock’s recent price movement, along with supportive indicators, suggests it could be ready for further gains.
Technical Strength: A Reliable Base
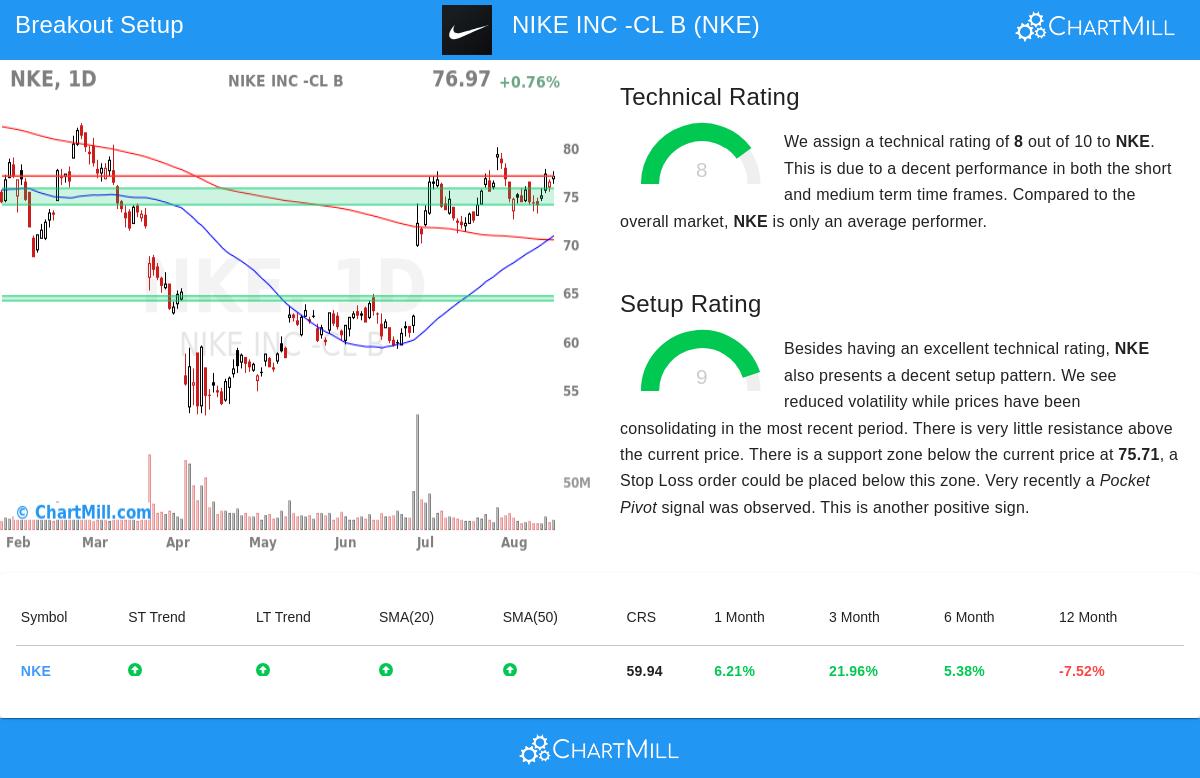
The ChartMill Technical Rating for NKE is 8 out of 10, reflecting a strong trend across various timeframes. Key elements contributing to this score include:
- Upward Trends in Short and Long Term – The stock is rising in daily and weekly timeframes, a key factor for traders who prefer momentum-driven moves.
- Solid Moving Average Support – NKE is trading above its 20-day, 50-day, and 100-day moving averages, reinforcing the bullish trend. The 20-day SMA (currently at $75.71) is climbing, serving as near-term support.
- Relative Strength – While NKE has lagged behind the S&P 500 over the past year (outperforming only 59% of stocks), its recent three-month gain (+21.96%) points to strengthening momentum.
These factors match the breakout strategy’s need for stocks in confirmed upward trends, lowering the chance of false breakouts. For a more detailed look at the technicals, see the full technical report here.
Setup Quality: A Defined Consolidation with Clear Risk Levels
The Setup Quality Rating of 9 highlights a well-formed consolidation pattern, making NKE a promising candidate for a breakout trade. Key details include:
- Narrow Trading Range – Over the past month, NKE has moved between $72.53 and $79.99, with recent prices stabilizing near the higher end of this range.
- Support and Resistance Areas –
- Support at $74.02,$75.71 – A mix of moving averages and trendlines offers a logical stop-loss zone.
- Resistance at $76.98 – A move above this level could spark additional upward momentum.
- Lower Volatility – The Average True Range (ATR) of 2.52% indicates decreasing volatility, often a sign of an impending decisive move.
- Pocket Pivot Signal – Recent accumulation signals (where price climbs on higher volume than recent down days) add more bullish confirmation.
This setup fits the breakout strategy’s focus on low-risk entries—traders can set a buy-stop order above resistance ($76.99) with a stop-loss just below support ($74.01), capping potential losses at ~3.87%.
Why This Matters for Breakout Traders
Breakout strategies depend on two conditions:
- A strong underlying trend (confirmed by the Technical Rating) to ensure continuation.
- A tight consolidation (measured by the Setup Rating) to pinpoint entry and exit levels.
NKE currently meets both, presenting a favorable risk/reward scenario. While no setup is certain, the mix of technical strength and a well-defined base improves the odds of a successful trade.
For traders looking for similar opportunities, the Technical Breakout Setups screener offers a daily list of high-potential stocks.
Disclaimer: This analysis is for informational purposes only and should not be seen as investment advice. Always conduct your own research and apply risk management strategies before trading.