
Our stock screener has detected a potential breakout setup on NISOURCE INC (NYSE:NI). This breakout pattern is observed when a stock consolidates following a strong upward movement. It's important to note that this pattern is based on technical analysis, and the actual breakout outcome is uncertain. However, it might be worth keeping an eye on NYSE:NI.
What is the technical picture of NI telling us.
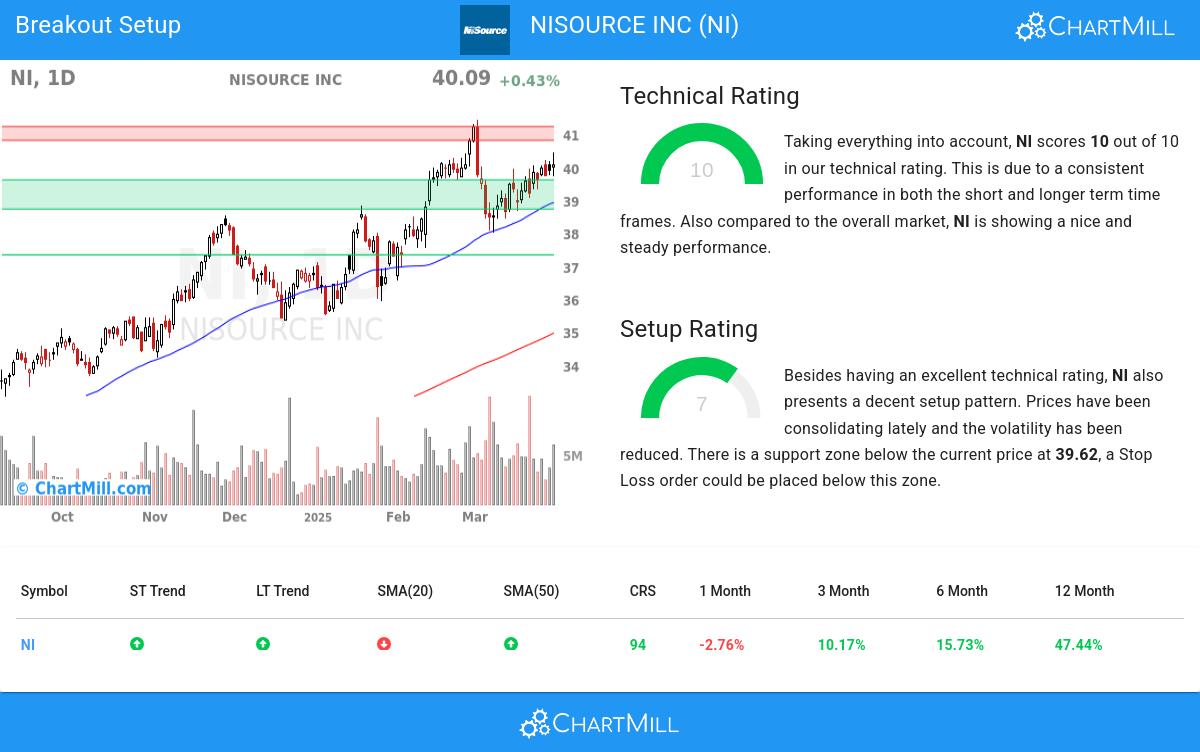
ChartMill assigns a proprietary Technical Rating to each stock. The score is computed daily by evaluating various technical indicators and properties. The score ranges from 0 to 10.
Overall NI gets a technical rating of 10 out of 10. Both in the recent history as in the last year, NI has proven to be a steady performer, scoring decent points in every aspect analyzed.
- The long and short term trends are both positive. This is looking good!
- When comparing the yearly performance of all stocks, we notice that NI is one of the better performing stocks in the market, outperforming 94% of all stocks. On top of that, NI also shows a nice and consistent pattern of rising prices.
- NI is one of the better performing stocks in the Multi-Utilities industry, it outperforms 100% of 25 stocks in the same industry.
- NI is currently trading near its 52 week high. This is a good sign, certainly because the S&P500 Index is not trading near new highs.
- In the last month NI has a been trading in the 38.02 - 41.45 range, which is quite wide. It is currently trading in the middle of this range where prices have been consolidating recently, this may present a good entry opportunity, but some resistance may be present above.
Check the latest full technical report of NI for a complete technical analysis.
How does the Setup look for NI
Next to the Technical Rating, the Setup Rating of a stock determines to which extend the stock is consolidating. This score also ranges from 0 to 10 and is updated daily. The setup score evaluates various short term technical indicators. For NI this score is currently 7:
NI has an excellent technical rating and also presents a decent setup pattern. We see reduced volatility while prices have been consolidating in the most recent period. There is a support zone below the current price at 39.62, a Stop Loss order could be placed below this zone.
How can NI be traded?
A breakout opportunity may arise when the stock surpasses the current consolidation zone and reaches new highs. Traders often wait for this breakout before considering buying the stock. To manage risk, a stop loss order could be placed below the consolidation zone to limit potential losses.
Disclaimer: This article is not intended to provide trading advice. It is crucial to conduct your own analysis and consider your own observations and trading style when making investment decisions. The article solely presents technical observations and should not be relied upon as a sole basis for trading.
Our Breakout screener lists more breakout setups and is updated daily.
Disclaimer
Important Note: The content of this article is not intended as trading advice. It is essential to perform your own analysis and exercise caution when making trading decisions. The article presents observations created by automated analysis but does not guarantee any trading or investment outcomes. Always trade responsibly and make independent judgments.