
Here's NEUROCRINE BIOSCIENCES INC (NASDAQ:NBIX) for you, a growth stock our stock screener believes is undervalued. NBIX is scoring impressively in terms of growth while demonstrating strong financials. On top of that, it remains attractively priced. Let's break it down further.
Growth Analysis for NBIX
ChartMill assigns a proprietary Growth Rating to each stock. The score is computed by evaluating various growth aspects, like EPS and revenue growth. We take into account the history as well as the estimated future numbers. NBIX was assigned a score of 9 for growth:
- NBIX shows a strong growth in Earnings Per Share. In the last year, the EPS has been growing by 35.95%, which is quite impressive.
- The Earnings Per Share has been growing by 58.39% on average over the past years. This is a very strong growth
- The Revenue has grown by 24.81% in the past year. This is a very strong growth!
- NBIX shows a strong growth in Revenue. Measured over the last years, the Revenue has been growing by 24.48% yearly.
- The Earnings Per Share is expected to grow by 38.15% on average over the next years. This is a very strong growth
- The Revenue is expected to grow by 12.63% on average over the next years. This is quite good.
Analyzing Valuation Metrics
ChartMill assigns a proprietary Valuation Rating to each stock. The score is computed by evaluating various valuation aspects, like price to earnings and free cash flow, both absolutely as relative to the market and industry. NBIX was assigned a score of 6 for valuation:
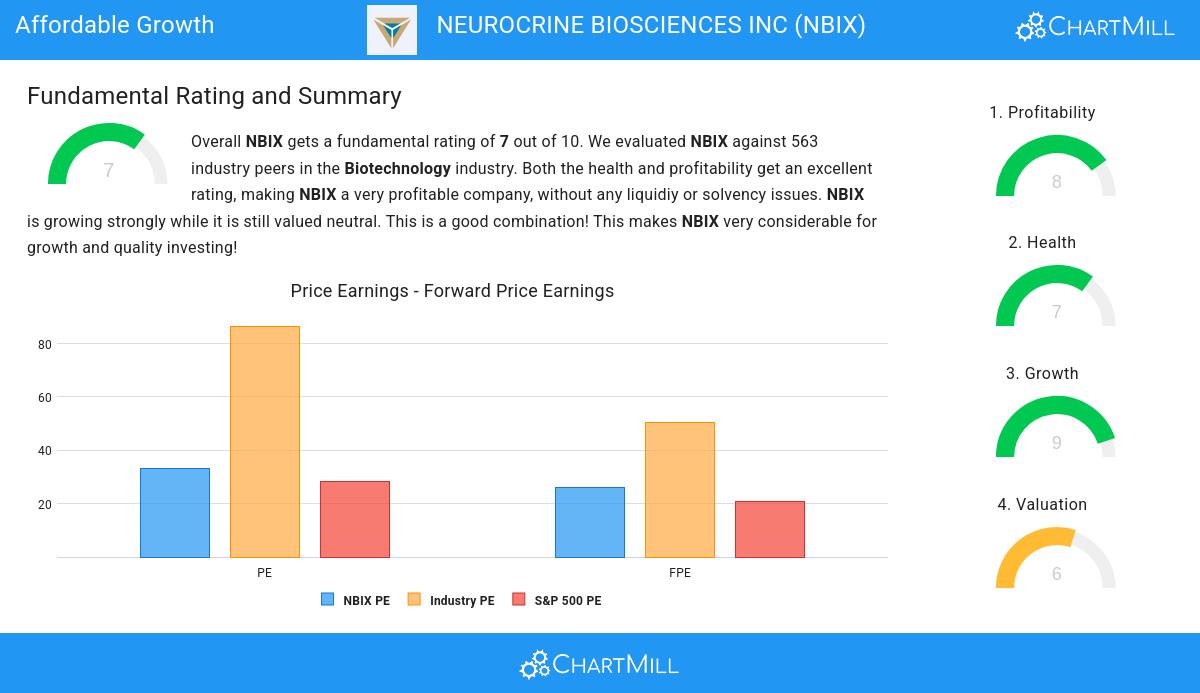
- Compared to the rest of the industry, the Price/Earnings ratio of NBIX indicates a rather cheap valuation: NBIX is cheaper than 94.14% of the companies listed in the same industry.
- Compared to the rest of the industry, the Price/Forward Earnings ratio of NBIX indicates a rather cheap valuation: NBIX is cheaper than 92.72% of the companies listed in the same industry.
- 96.27% of the companies in the same industry are more expensive than NBIX, based on the Enterprise Value to EBITDA ratio.
- NBIX's Price/Free Cash Flow ratio is rather cheap when compared to the industry. NBIX is cheaper than 95.56% of the companies in the same industry.
- The excellent profitability rating of NBIX may justify a higher PE ratio.
- NBIX's earnings are expected to grow with 40.71% in the coming years. This may justify a more expensive valuation.
Looking at the Health
Every stock is evaluated by ChartMill, receiving a Health Rating on a scale of 0 to 10. This assessment considers different health aspects, including liquidity and solvency, both in absolute terms and relative to industry peers. NBIX has achieved a 7 out of 10:
- An Altman-Z score of 7.32 indicates that NBIX is not in any danger for bankruptcy at the moment.
- NBIX's Altman-Z score of 7.32 is amongst the best of the industry. NBIX outperforms 83.84% of its industry peers.
- There is no outstanding debt for NBIX. This means it has a Debt/Equity and Debt/FCF ratio of 0 and it is amongst the best of the sector and industry.
- A Current Ratio of 3.40 indicates that NBIX has no problem at all paying its short term obligations.
- NBIX has a Quick Ratio of 3.28. This indicates that NBIX is financially healthy and has no problem in meeting its short term obligations.
Profitability Analysis for NBIX
ChartMill employs its own Profitability Rating system for stock evaluation. This score, ranging from 0 to 10, is derived from an analysis of diverse profitability metrics and margins. In the case of NBIX, the assigned 8 is noteworthy for profitability:
- NBIX has a Return On Assets of 9.18%. This is amongst the best in the industry. NBIX outperforms 95.20% of its industry peers.
- NBIX has a better Return On Equity (13.18%) than 94.85% of its industry peers.
- Looking at the Return On Invested Capital, with a value of 13.20%, NBIX belongs to the top of the industry, outperforming 96.45% of the companies in the same industry.
- The last Return On Invested Capital (13.20%) for NBIX is above the 3 year average (11.40%), which is a sign of increasing profitability.
- Looking at the Profit Margin, with a value of 14.49%, NBIX belongs to the top of the industry, outperforming 95.56% of the companies in the same industry.
- In the last couple of years the Profit Margin of NBIX has grown nicely.
- NBIX has a better Operating Margin (24.75%) than 96.63% of its industry peers.
- Looking at the Gross Margin, with a value of 98.56%, NBIX belongs to the top of the industry, outperforming 97.34% of the companies in the same industry.
More Affordable Growth stocks can be found in our Affordable Growth screener.
Our latest full fundamental report of NBIX contains the most current fundamental analsysis.
Disclaimer
This is not investing advice! The article highlights some of the observations at the time of writing, but you should always make your own analysis and invest based on your own insights.

