
Investors looking to find high-potential stocks frequently use systematic methods that combine strict technical study with fundamental growth measures. One well-known method is the Mark Minervini strategy, which uses a defined Trend Template to locate equities in established, strong uptrends. This template serves as a filter, requiring a stock to show solid price momentum, good moving average arrangements, and leadership through high relative strength before it is reviewed. For investors focused on growth, this technical base is combined with a study of quickening earnings and sales growth, the fundamental driver that can push a stock's rise. The aim is to locate firms where better business results meet a technically healthy chart, forming a possible situation for major price gains.
MAXLINEAR INC (NASDAQ:MXL) recently appeared from a scan made to find such meetings, sorting for stocks that meet Minervini's Trend Template while also having a High Growth Momentum (HGM) rating, indicating solid fundamental momentum.
Reviewing the Trend Template Fit
The Minervini Trend Template is based on a set of strict technical rules made to filter for stocks in a clear Stage 2 uptrend. A look at MXL's chart and main numbers shows a positive fit with these rules:
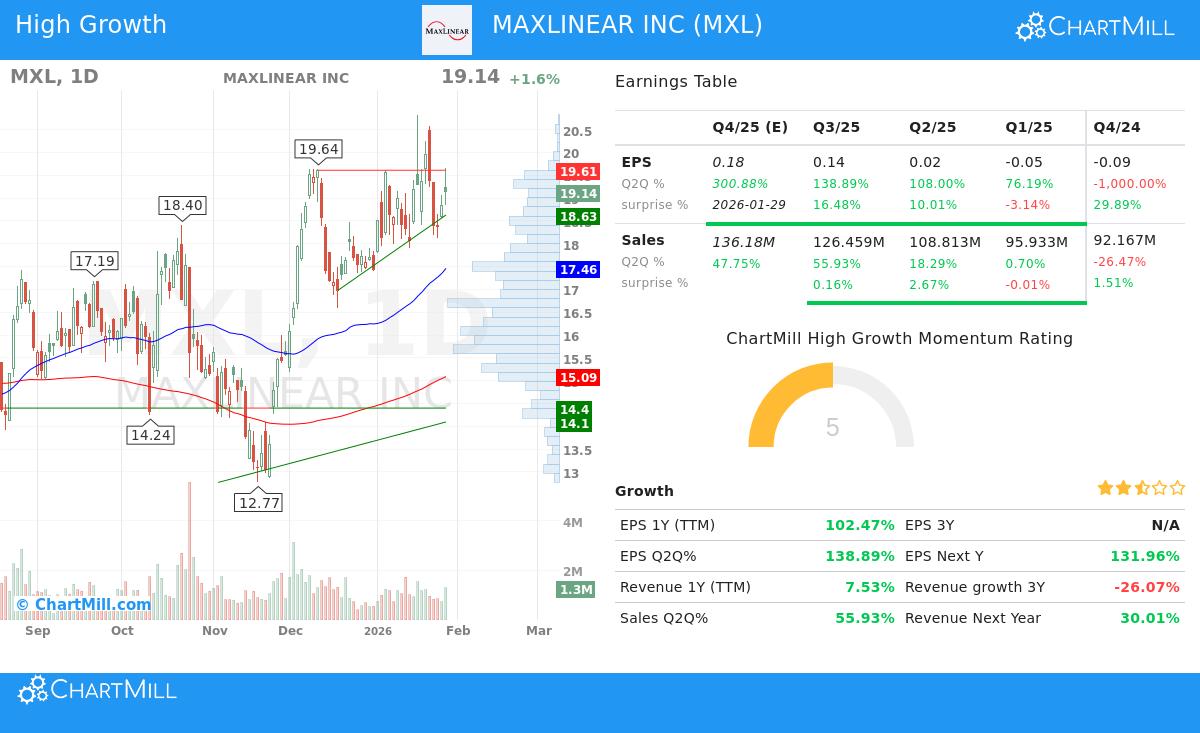
- Price Above Main Moving Averages: MXL's last price of $19.14 trades well above its rising 50-day ($17.46), 150-day ($16.29), and 200-day ($15.09) simple moving averages. This ordered arrangement is a typical sign of continued positive momentum across several time periods.
- Moving Average Direction and Order: Importantly, the longer-term averages are not just price support levels but are also moving upward. The 200-day SMA has risen from $15.05, confirming a positive long-term direction. Also, the 50-day SMA is above both the 150-day and 200-day SMAs, an order Minervini highlights as proof of increasing buyer interest.
- Nearness to Highs: The stock is now within 25% of its 52-week high of $20.82, trading just over 8% below that top. At the same time, at its present level, MXL sits more than 129% above its 52-week low of $8.35. This pairing, being close to a high while well above the low, is a sign of leadership, showing the stock has already made a major recovery and is gathering strength for a possible next move higher.
- Relative Strength: With a ChartMill Relative Strength (CRS) ranking of 77.78, MXL performs better than more than three-quarters of the market. While Minervini often wants scores above 80 for top leadership, a ranking in the high 70s still shows clear outperformance and is a good point within the template's structure.
This combined technical view indicates MXL is not in a casual rebound but is working within a clear, long-term uptrend with definite institutional support, the exact setting the Trend Template is made to find.
Examining the High Growth Momentum
A healthy chart is only part of the picture. The Minervini idea strongly values fundamental improvement, stating that the largest stock winners are nearly always backed by strong gains in earnings and sales. MXL's recent financial numbers show several signs of high-growth momentum that support its scan selection.
- Strong Quarterly Earnings Growth: The latest quarterly EPS grew by 138.9% compared to the same quarter last year. This comes after a previous quarter where EPS grew by 108%. This sequence of quickening, triple-digit percentage growth on a quarterly basis is a strong catalyst that draws institutional notice.
- Solid Sales Improvement: Matching the earnings trend, revenue growth has jumped. Last quarter's sales rose by 55.9% year-over-year, a sharp improvement from the almost unchanged growth (0.7%) seen two quarters before. This return in top-line growth is important, as lasting earnings growth usually needs sales momentum.
- Positive Analyst Changes: The average analyst estimate for next year's EPS has been increased by 9.09% over the last three months. Upward changes are a main part of the Minervini method, as they show growing belief in the company's future profits and often come before more institutional buying.
- Good Estimate Beat Record: The company has beaten EPS estimates in three of the last four quarters, with an average beat of 13.3%. A steady history of surpassing expectations builds trust and can lead to higher valuations.
These points build a positive growth story. While yearly numbers may show changes due to industry cycles, the sharp positive turn in recent quarterly performance, especially the strong pairing of jumping sales and surging earnings, is exactly the kind of fundamental catalyst the method aims to find early.
Technical Condition and Situation Summary
Beyond the exact Trend Template rules, MXL's overall technical condition is rated well. ChartMill's own Technical Rating for the stock is a good 8 out of 10, backed by positive long-term and short-term trends. The study notes the stock is trading in the higher part of its yearly range and shows acceptable liquidity.
The technical report also finds a consolidation pattern forming near recent highs, with clear support and resistance areas. A support area between $18.41 and $19.01, formed by a meeting of moving averages and trendlines, gives a possible zone for a reasonable stop-loss level if a trade is reviewed. The presence of a recent "Pocket Pivot" signal, a volume-based sign of accumulation, adds another positive technical detail.
For a full breakdown of the support and resistance levels, and the automated trade situation from this study, you can see the complete ChartMill Technical Report for MXL.
Summary
MAXLINEAR INC shows a case where a structured scanning process has found a meeting of main factors. Technically, the stock fits the strict needs of the Minervini Trend Template, displaying a strong uptrend with correct moving average order and relative strength. Fundamentally, it shows signs of high-growth momentum, with recent quarters revealing strong improvements in both earnings and sales, along with positive analyst changes.
This combination of a technically healthy chart and better business fundamentals is the center of the chosen strategy. It tries to find companies where positive momentum is starting to be seen by the market, giving a measured chance based on exact, repeatable rules instead of guesswork.
Interested in finding other stocks that now meet this mix of technical health and growth momentum? You can view the live scan results through this High Growth Momentum + Trend Template Screener.
Disclaimer: This article is for information and learning only. It is not meant as investment advice, nor is it a suggestion to buy, sell, or hold any security. The study is based on given data and specific scanning methods. Always do your own complete research and think about your personal money situation and risk tolerance before making any investment choices.