
Investors looking to find leading stocks with solid momentum and strong basic fundamentals often use systematic methods. One such method, made famous by legendary trader Mark Minervini, joins a strict technical checklist, the Trend Template, with a focus on speeding earnings and sales growth. This two-part strategy tries to catch stocks in strong uptrends that also have backing from getting better company performance, a pairing that can point to major future possibility. A recent filter using these ideas has pointed out infrastructure expert MasTec Inc (NYSE:MTZ) as a candidate worth more study.
A Primer on the Minervini Trend Template
At its heart, the Minervini Trend Template is a group of fixed technical rules made to filter for stocks in clear, steady uptrends. The idea is straightforward: concentrate money on market leaders that are already showing strength, instead of trying to guess a change in weaker performers. The template requires specific arrangements of important moving averages, nearness to 52-week highs, and better relative strength compared to the wider market. When joined with a basic filter for high growth momentum, looking for speeding earnings, revenue surprises, and positive estimate changes, the strategy aims to find companies where technical momentum is supported by real business gain.
How MasTec Matches the Technical Plan
A look at MasTec's chart and technical data shows a stock that now meets the strict needs of the Trend Template. This match is key, as it factually confirms the stock is in a Stage 2 advance, the period where Minervini's study shows the largest gains usually happen.
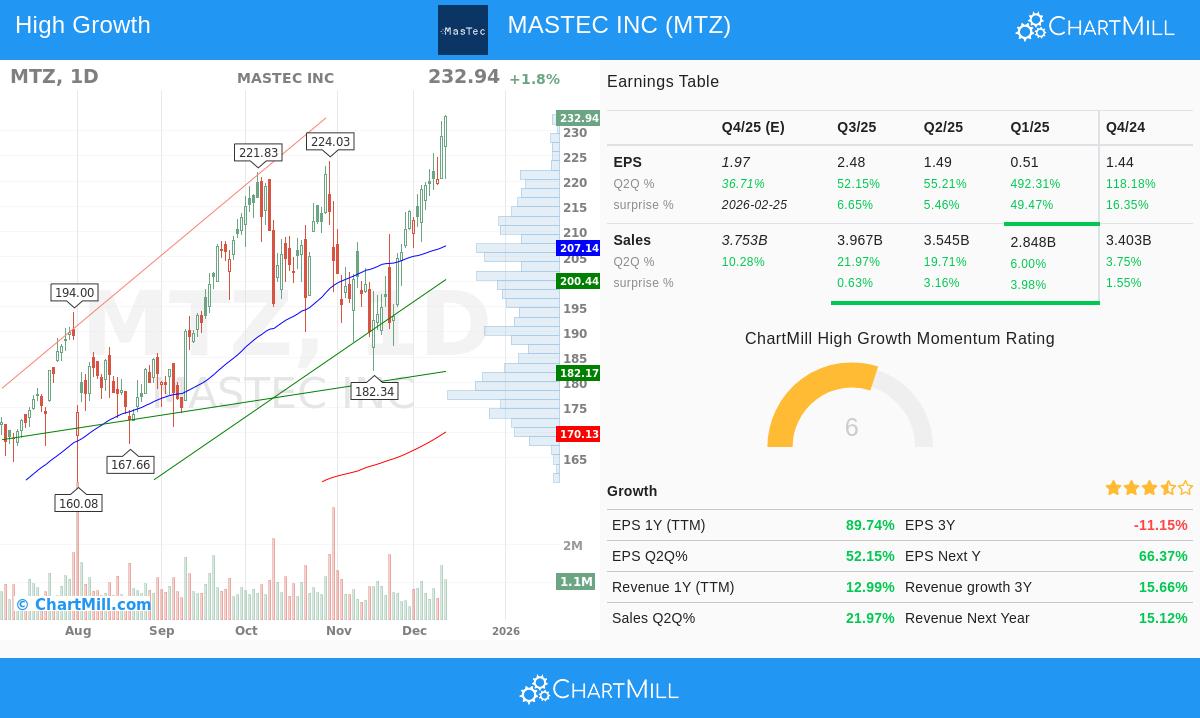
- Price vs. Moving Averages: The stock's last price of $232.94 trades well above its rising 50-day ($207.14), 150-day ($185.96), and 200-day ($170.13) simple moving averages (SMAs). Also, the 50-day SMA is above the 150-day SMA, which is above the 200-day SMA, making the perfect bullish arrangement the template requires.
- Nearness to Highs: MasTec is trading within 1% of its 52-week high of $233.14, easily within the template's need of being within 25% of the high. At the same time, the current price is over 130% above its 52-week low of $99.70, much more than the 30% minimum level. This shows strong bounce momentum and a place of strength.
- Better Relative Strength: With a ChartMill Relative Strength (CRS) score of 92.01, MasTec does better than 92% of all stocks over the past year. High relative strength is a key part of the Minervini method, finding stocks that are leadership candidates, not just moving with a wide market tide.
The Fundamental Growth Driver
While a strong chart is needed, Minervini stresses that the largest winners are pushed by fundamental speeding up. MasTec's recent financial numbers hint it may be in such a period, making it fit for high-growth momentum filters.
- Earnings Increase: The company's trailing twelve-month (TTM) EPS is at $5.92, showing a year-over-year growth of almost 90%. More key, recent quarterly patterns show fast speeding up: EPS growth in the newest quarter was 52% year-over-year, before quarters showing growth of 55%, 492%, and 118%. This pattern of strong and speeding bottom-line growth is just what high-momentum investors look for.
- Steady Performance: MasTec has beaten analyst EPS guesses in each of the last four quarters, with an average surprise of over 19%. It has also topped revenue guesses in all four periods. This steady skill to beat guesses builds trust and can push positive estimate changes.
- Getting Better Profitability: After a time of margin squeeze, there are clear signs of getting better. The profit margin in the last reported quarter was 4.05%, a major step-by-step gain and a positive direction in how well it runs.
- Analyst Trust: The fundamental story is getting notice, as shown by upward changes. The average analyst guess for next year's EPS has been changed upward by 2.08% over the past three months, pointing to growing trust in the company's path forward.
Technical Condition and Current Position
ChartMill's own analysis gives a combined view of the stock's technical state. MasTec gets a top-level Technical Rating of 10 out of 10, showing very good health across many time frames. The report says the long and short-term trends are both positive, the stock is doing better than most of its Construction & Engineering industry friends, and it is trading at new 52-week highs.
However, the Setup Quality Rating is now a 3. This is an important difference: while the stock's trend is perfect, its recent price jump has made it "stretched" in the short term. The report hints the price move has been too jumpy to find a low-risk entry point, telling investors to wait for a time of settling or a move back toward support levels before thinking about a new position. This points out a key real part of the strategy, finding a strong candidate is only the first step; entering at a careful price point with a set risk is key.
For a full breakdown of the support levels, trend study, and full technical summary, you can look at the complete ChartMill Technical Report for MTZ.
Conclusion
MasTec Inc shows a strong example of a stock that fits a strict growth and momentum investment plan. It meets the strict technical rules of the Minervini Trend Template, confirming its place as a market leader in a strong uptrend. Basically, it shows the signs of a high-growth momentum candidate, with quickly speeding earnings, steady estimate beats, and getting better margins. While its strong rise has for now lessened the quality of its immediate entry position, it stays a main candidate for investors' watchlists. The next clear step for investors using this method would be to watch MTZ for a building pause or move back that would give a higher-chance, lower-risk entry point fitting the strategy's risk control ideas.
Interested in finding more stocks that fit this high-growth momentum shape? You can run the same filter that found MasTec using the High Growth Momentum + Trend Template screener on ChartMill.
Disclaimer: This article is for information and learning only. It is not meant as investment advice, nor does it make a suggestion to buy, sell, or hold any security. The study is based on given data and described methods, which may change. Investors should do their own research and talk with a qualified financial advisor before making any investment choices. Please read our full disclaimer here.