
Technical breakout strategies focus on identifying stocks that show strong technical conditions and are forming patterns that may lead to an upward move. The method uses two main indicators: the ChartMill Technical Rating, which measures the stock’s trend and performance, and the ChartMill Setup Quality Rating, which checks if the stock is shaping a high-chance breakout pattern. Stocks with high scores in both areas often offer good trading opportunities.
Millrose Properties (NYSE:MRP) has appeared in this type of scan, showing traits that fit the strategy. The stock’s technical setup looks promising, with a mix of trend strength, consolidation, and clear support and resistance levels.
Technical Strength: A Strong Base
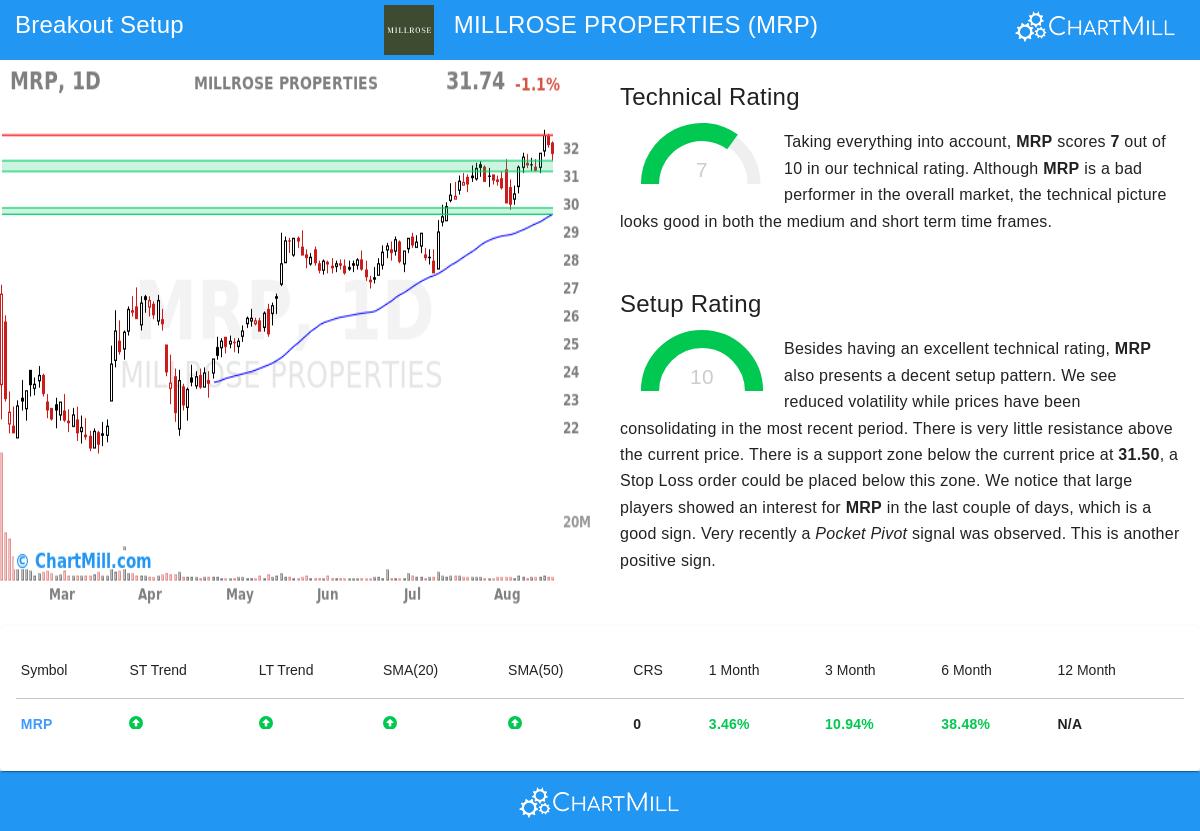
The ChartMill Technical Rating for MRP is 7 out of 10, pointing to a solid trend. Key reasons for this score include:
- Upward Trends Across Timeframes – Both short-term and long-term trends are positive, supporting a bullish outlook.
- Moving Averages Acting as Support – The stock is above its 20-day, 50-day, and 100-day moving averages, all of which are rising, indicating steady demand.
- Recent Gains – MRP has risen 10.94% in the last three months and 38.48% in the last six months, doing better than many similar stocks, though still behind the broader market.
However, the stock’s performance compared to the overall market is weak, with 100% of other stocks doing better over the past year. This means MRP’s momentum is strong internally but may not yet be widely recognized.
Setup Quality: A Tight Pattern with Breakout Signs
The Setup Quality Rating for MRP is a perfect 10, showing an ideal consolidation. Key features of this setup are:
- Low Volatility & Narrow Range – Over the past month, MRP has moved between $29.73 and $32.60, with recent prices near the top of this range. This tightening often comes before a breakout.
- Clear Support Areas – Multiple support levels exist below the current price, including:
- $31.11–$31.50 (short-term support from moving averages and trendlines)
- $29.58–$29.81 (mid-term support)
- $27.20–$27.57 (long-term support)
- Institutional Activity – Larger investors have increased buying, shown by the Effective Volume metric, and a recent Pocket Pivot signal—a bullish volume and price pattern—adds to the case for accumulation.
The stock is close to resistance at $32.41, and a move above this level could lead to further gains.
Trade Setup Details
The technical analysis suggests a possible trade:
- Entry: A buy-stop order at $32.42, just above resistance.
- Stop-loss: $31.10, below the nearest support area.
- Risk/Reward: The trade risks 4.07% of capital for a potential breakout.
While the setup looks promising, traders should:
- Watch overall market conditions (the S&P 500 is in a positive trend, which helps bullish breakouts).
- Be mindful of earnings reports or sector news that could affect the pattern.
Find More Breakout Candidates
For traders looking for other high-quality breakout setups, the Technical Breakout Setups Screen offers a filtered list of stocks meeting similar criteria.
Disclaimer: This analysis is for informational purposes only and should not be taken as investment advice. Always do your own research and manage risk before trading.