
For investors looking to join solid technical momentum with sound fundamental growth, the method created by Mark Minervini gives a structured system. This process, called the Specific Entry Point Analysis (SEPA), sorts the market by requiring stocks to satisfy two strict groups of conditions. Initially, they need to pass the technical "Trend Template," which finds securities in strong, confirmed uptrends. Next, they must show the fundamental traits of a company with fast growth, like rising earnings and sales. This two-step sorting method tries to find market leaders early in their large price gains, where the combination of technical force and fundamental speed makes a high-likelihood situation for notable returns.
MidWestOne Financial Group Inc. (NASDAQ:MOFG) has lately appeared on a scan made to locate stocks that meet both the Minervini Trend Template and a profile of fast growth momentum. As a regional bank holding company from Iowa City, its presence on this scan indicates a notable mix of price movement and business results that deserves more examination.
Checking the Technical Base: The Minervini Trend Template
The center of Minervini's method is to trade along the strongest trends, staying away from buying low-priced stocks in favor of purchasing strength. The Trend Template gives a definite list to confirm a stock is in a verified Stage 2 upward move. A check of MOFG's main measures shows it meets these important technical levels:
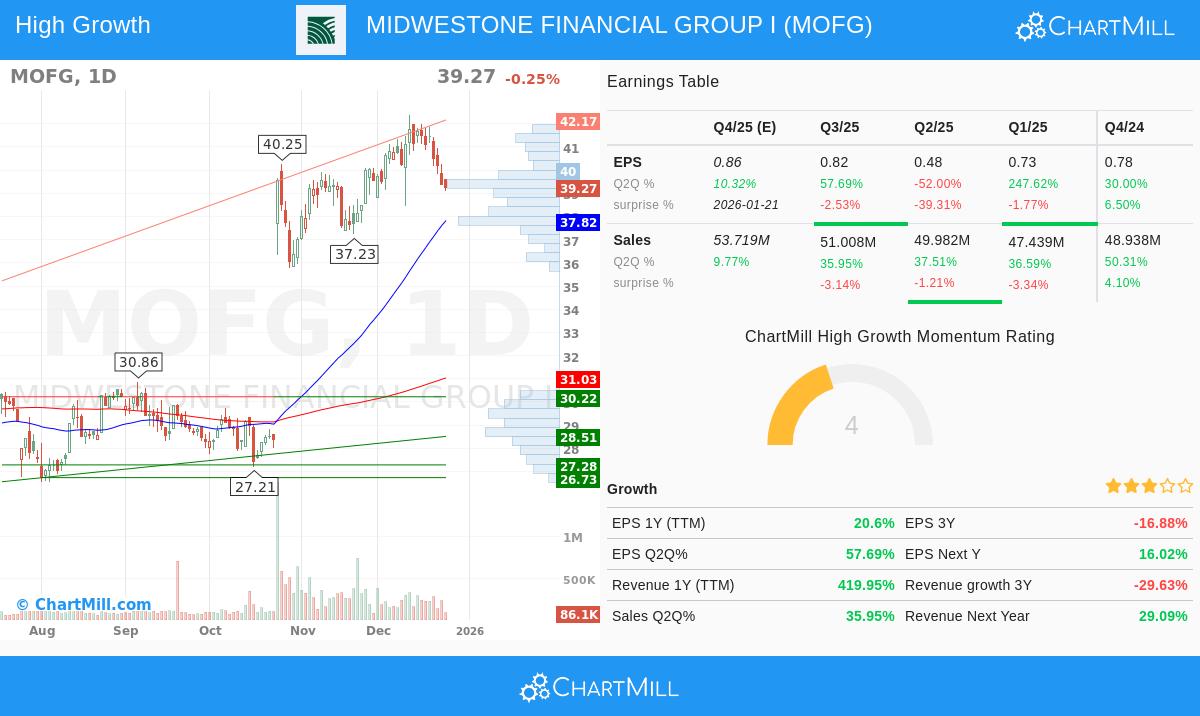
- Price Above Main Moving Averages: The stock's last price of $39.27 trades well above its rising 50-day ($37.82), 150-day ($31.90), and 200-day ($31.03) simple moving averages (SMAs). This order confirms the stock is in a continued uptrend across several time periods.
- Moving Average Order: The 50-day SMA is positioned above both the 150-day and 200-day SMAs, and the 150-day SMA is above the 200-day SMA. This "ordered" arrangement is a classic signal of increasing bullish momentum and is a key part of the Trend Template.
- Nearness to Highs: MOFG's present price is within 25% of its 52-week high of $42.38, a rule that concentrates on stocks showing leadership and momentum instead of those stuck near lows.
- Solid Relative Strength: With a ChartMill Relative Strength (CRS) score of 90.45, MOFG does better than over 90% of all stocks in the market. High relative strength is a strict filter in the Minervini system, as it finds the market's leaders during uptrends.
This technical view shows MOFG as a stock in a strong uptrend, having settled after a major rise from its 52-week low of $24.62. The situation indicates the main trend is continuing and the stock is placing itself inside a higher trading band.
Checking the Growth Driver: Fast Growth Momentum
While a good chart is necessary, Minervini states that the largest winners are nearly always backed by better fundamental growth. The "Fast Growth Momentum" part of the scan looks for companies displaying speed in their financial results. MOFG's lately reported numbers show several good points:
- Earnings Speed: The company's latest quarterly earnings per share increased 57.7% compared to the same quarter last year. This comes after a large 247.6% growth rate two quarters before. While quarterly results can change, this sequence of major positive year-over-year comparisons is just what growth investors look for.
- Sound Yearly Earnings Growth: On a trailing twelve-month (TTM) basis, EPS has grown 20.6%, showing good basic profit expansion.
- Solid Profit Margins: The most recent quarterly profit margin was 27.8%, a large rebound from the 16.6% margin reported the quarter before. This gain in operational effectiveness is a main quality filter for growth investors.
- Revenue Momentum: Top-line growth is also there, with last quarter's revenue rising 35.9% year-over-year.
These measures show that MOFG's recent price force is not happening alone. It is matching a time of clearly better profitability and sales growth, a pairing that often draws institutional attention and can support more price gains.
Technical Analysis Summary
ChartMill's own technical report gives MOFG a score of 7 out of 10, stating it is "one of the better performers" but seeing some short-term consolidation. The report notes a clear support area around $39.26 and finds resistance in the $40.55 to $41.77 range, an area that matches the stock's recent 52-week high. The analysis indicates the stock is in a pause inside its bigger uptrend, which could be making a possible entry situation for traders looking for a new move above resistance on high volume.
For a full look at the support, resistance, and trade situation analysis, you can see the complete ChartMill Technical Report for MOFG.
A Subject for More Study
MidWestOne Financial Group shows a situation where a regional bank stock is displaying traits often linked with fast-growth stocks: a strong price trend supported by speeding earnings and growing margins. It meets the strict technical filters of the Minervini Trend Template, confirming its market leadership, while its fundamental measures show the sort of momentum that can maintain a long upward move.
For investors and traders using a growth-and-momentum method, MOFG justifies a spot on a watchlist. The important point will be to watch how it deals with the resistance near its highs and if it can move out of its present consolidation with the volume-supported force that marks good breakouts.
Looking to find more stocks that match this mix of strong trends and fast growth? You can use the same scan with the Fast Growth Momentum + Trend Template scanner on ChartMill.
,
Disclaimer: This article is for informational and educational purposes only. It is not a recommendation to buy or sell any security. The analysis is based on data provided and specific screening criteria. Always conduct your own due diligence, consider your risk tolerance, and consult with a qualified financial advisor before making any investment decisions. Past performance is not indicative of future results.