
Technical breakout strategies focus on spotting stocks with strong trends that are consolidating in a narrow range, providing a possible entry point as they continue their upward movement. The method uses two main metrics: the ChartMill Technical Rating, which measures a stock’s overall trend strength, and the Setup Quality Rating, which checks if the stock is forming a reliable consolidation pattern. Stocks that perform well on both metrics often present good risk-reward opportunities for traders.
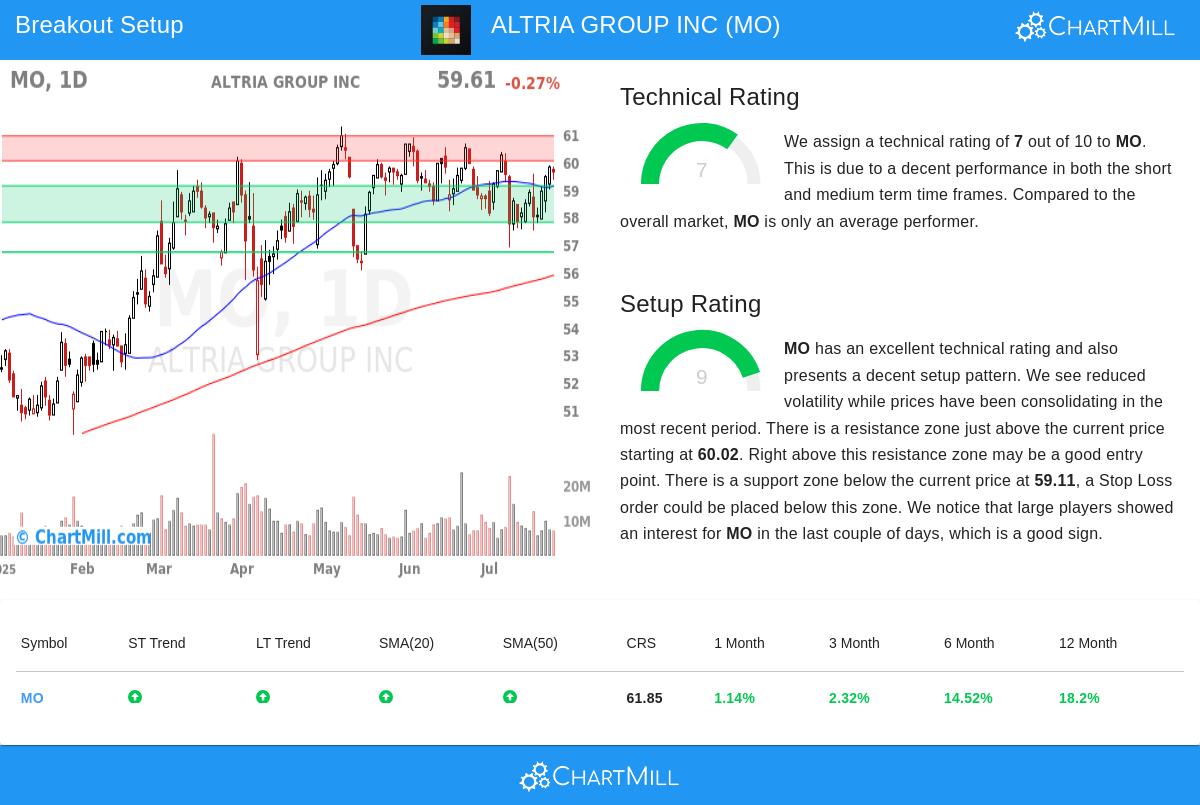
Altria Group Inc (NYSE:MO) currently matches this breakout setup, with a Technical Rating of 7 and a Setup Rating of 9, showing both a steady trend and a clear consolidation. Below, we look at why MO fits the criteria for a potential breakout candidate.
Technical Strength: A Steady Uptrend
The ChartMill Technical Rating checks multiple factors, including trend strength, moving averages, and relative performance. MO’s rating of 7 indicates:
- Positive Trends: Both short-term and long-term trends are upward, a key factor for breakout strategies since it raises the chance of continuation.
- Strong Moving Averages: The stock is above its 20-day, 50-day, 100-day, and 200-day moving averages, showing broad support.
- Relative Strength: MO performs better than 61% of all stocks over the past year, though it slightly trails the broader market, which is near record highs.
These factors suggest MO is in a steady uptrend, making it a candidate for continuation if the breakout occurs. For more details, see the full technical report.
Setup Quality: Narrow Consolidation with Clear Levels
The Setup Quality Rating of 9 highlights a well-formed consolidation, which is important for finding low-risk entry points. Key points include:
- Support and Resistance Zones: A clear resistance zone is between $60.02,$60.92, while support is near $57.79,$59.11. A breakout above resistance could signal more upside.
- Lower Volatility: The stock has traded in a $56.86,$60.36 range over the past month, with recent price action tightening near the upper bound, a common sign of a breakout.
- Institutional Interest: Large investors have shown more buying activity, adding confidence to the setup.
The mix of a strong trend and a high-quality consolidation makes MO an appealing candidate for traders looking for a breakout opportunity.
Possible Trade Setup
The automated analysis suggests:
- Entry: A buy stop above resistance at $60.93.
- Stop Loss: Below support at $57.78, limiting downside risk to 5.17%.
- Portfolio Allocation: A 19.34% position size would keep portfolio risk at 1%, assuming the stop is hit.
While this setup is generated automatically, traders should always verify the levels, check for upcoming earnings or news, and adjust stops based on their risk tolerance.
Finding More Breakout Opportunities
The Technical Breakout screen updates daily with new setups. For more candidates, explore the latest results here.
Disclaimer: This analysis is not investment advice. Always conduct your own research and consider risk management before trading.