
For investors looking to assemble a portfolio of durable, long-term holdings, the ideas of quality investing offer a useful structure. This method centers on finding companies with lasting competitive strengths, sound financial condition, and the capacity to produce steady, superior profits through economic ups and downs. Instead of searching for steep discounts, quality investors frequently accept a reasonable price for outstanding businesses they can hold for many years. One organized way to find such companies is through a strict stock screening process, like the "Caviar Cruise" method, which selects for high returns on capital, reliable growth, and strong cash generation.
A recent use of this screen has identified MAXIMUS INC (NYSE:MMS) as a possible candidate for more examination. The Virginia-based company, which runs and supplies technology for government health and human services programs worldwide, seems to display a number of important traits that match quality investing principles.
Match with Quality Screening Standards
The Caviar Cruise screen uses a multi-part filter to separate companies showing financial superiority. MAXIMUS displays a good match with several of these central measures, which are made to find businesses with effective operations and capital allocation that benefits shareholders.
- High Return on Invested Capital (ROIC): A central part of quality investing, a high ROIC shows a company's skill at creating profits from its capital base. The screen demands a ROIC (leaving out cash, goodwill, and intangibles) over 15%. MAXIMUS greatly passes this mark with a stated ROICexgc of 71.03%, pointing to a very effective use of capital in its main operations.
- Good and Rising Profitability: The screen seeks EBIT (Earnings Before Interest and Taxes) growth that is faster than revenue growth, indicating widening profit margins and possible pricing strength or scale benefits. MAXIMUS states a 5-year EBIT CAGR (Compound Annual Growth Rate) of 14.64%, showing a reliable history of increasing its core operating earnings.
- Prudent Financial Condition: To make sure a company can handle its debts without difficulty, the screen uses a Debt-to-Free Cash Flow ratio below 5. This ratio indicates how many years it would take to pay off all debt using present cash flow. MAXIMUS rests easily within this boundary with a ratio of 3.64, signaling a debt level that could be repaid in under four years at the current cash flow rate.
- Superior Earnings: The "Profit Quality" measure compares free cash flow to net income, showing how much accounting profit becomes real, usable cash. A number above 100% is very good. MAXIMUS has a 5-year average Profit Quality of 131.51%, meaning it creates much more free cash flow than its stated net income. This gives great financial room for dividends, share repurchases, debt payment, or new investment.
Fundamental Profile Summary
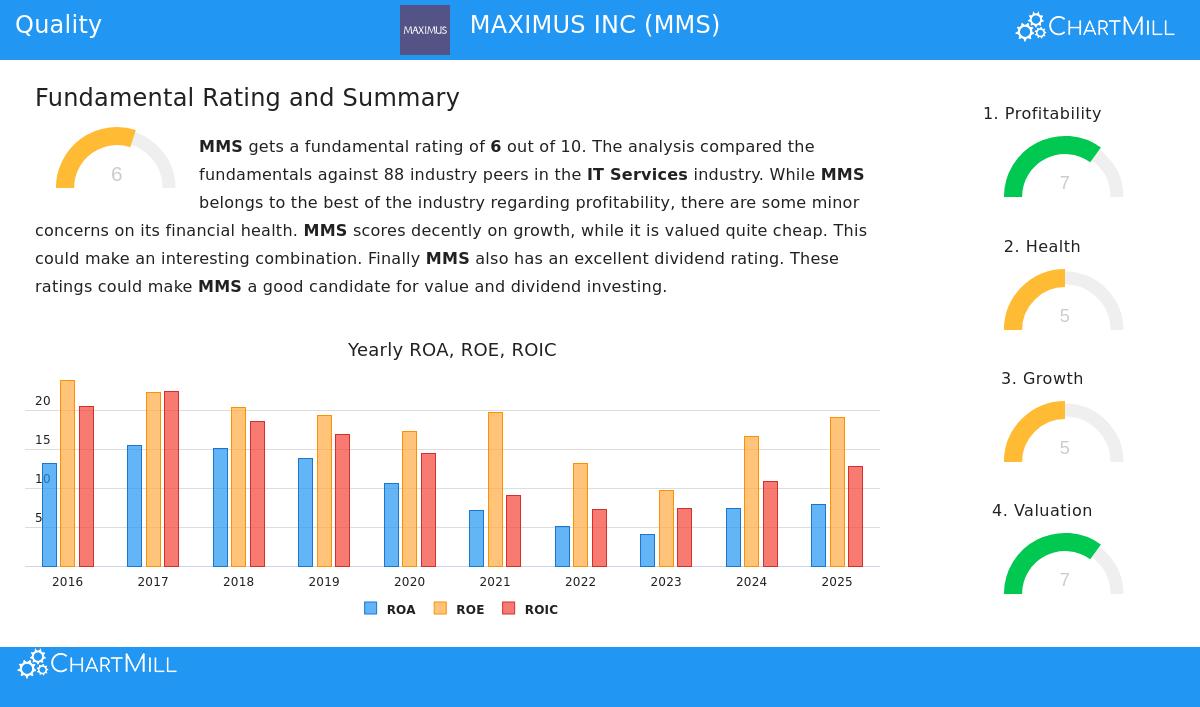
A look at the company's wider fundamental analysis report backs the initial screening outcomes. Chartmill gives MAXIMUS a fundamental rating of 6 out of 10, stating it shows an "interesting mix" of qualities.
- Profitability is a definite positive, with very good scores for Return on Equity (19.06%) and Return on Invested Capital (11.77%), both doing better than a big majority of its IT Services industry counterparts. Its operating margin has also gotten better in recent years.
- Valuation seems fair, if not low. The stock's Price-to-Earnings and Price-to-Forward-Earnings ratios are priced below most industry rivals and the wider S&P 500, possibly giving a good starting point for a company with its profitability.
- Growth & Dividends show a varied but steady image. While past revenue and EPS growth have been reliable, future revenue growth forecasts are moderate. Still, EPS growth is expected to stay good. The company also keeps a dependable, increasing dividend with a maintainable payout ratio.
- Financial Condition is acceptable, with a favorable Debt-to-FCF ratio and a sound Altman-Z score pointing to low short-term bankruptcy danger. Some small notes are made about its debt-to-assets ratio, but overall ability to pay debts is not a major problem.
For a complete look at these measures, you can see the full fundamental analysis report for MMS.
Points for the Quality Investor
While the numerical filters show a hopeful image, the non-numerical evaluation central to quality investing needs looking past the figures. MAXIMUS works in a specialty area, supplying necessary administrative and technological services to government bodies. This way of operating can give some stability during downturns and long-term predictability because of the constant need for such services. However, investors should think about items like contract renewal uncertainties, possible shifts in government spending focus, and the company's capacity to keep its high returns on capital as it grows. Its global presence across the U.S., U.K., and other markets gives variety, but also links it to geopolitical and regulatory details.
Locating Additional Quality Prospects
MAXIMUS acts as an illustration of the kind of company a strict quality screen can reveal. For investors wanting to use this method to find other possible candidates, the Caviar Cruise screen provides an organized beginning.
You can inspect the present results of this quality investing screen and change the settings yourself using the Caviar Cruise stock screener.
Disclaimer: This article is for informational purposes only and does not constitute financial advice, a recommendation, or an offer or solicitation to buy or sell any securities. The information presented is based on data provided and should not be the sole basis for an investment decision. Investors should conduct their own due diligence and consult with a qualified financial advisor before making any investment decisions.