
Consider MAXIMUS INC (NYSE:MMS) as a top pick for dividend investors, identified by our stock screening tool. MMS shines in terms of profitability, solvency, and liquidity, all while paying a decent dividend. Let's dive deeper into the analysis.
A Closer Look at Dividend for MMS
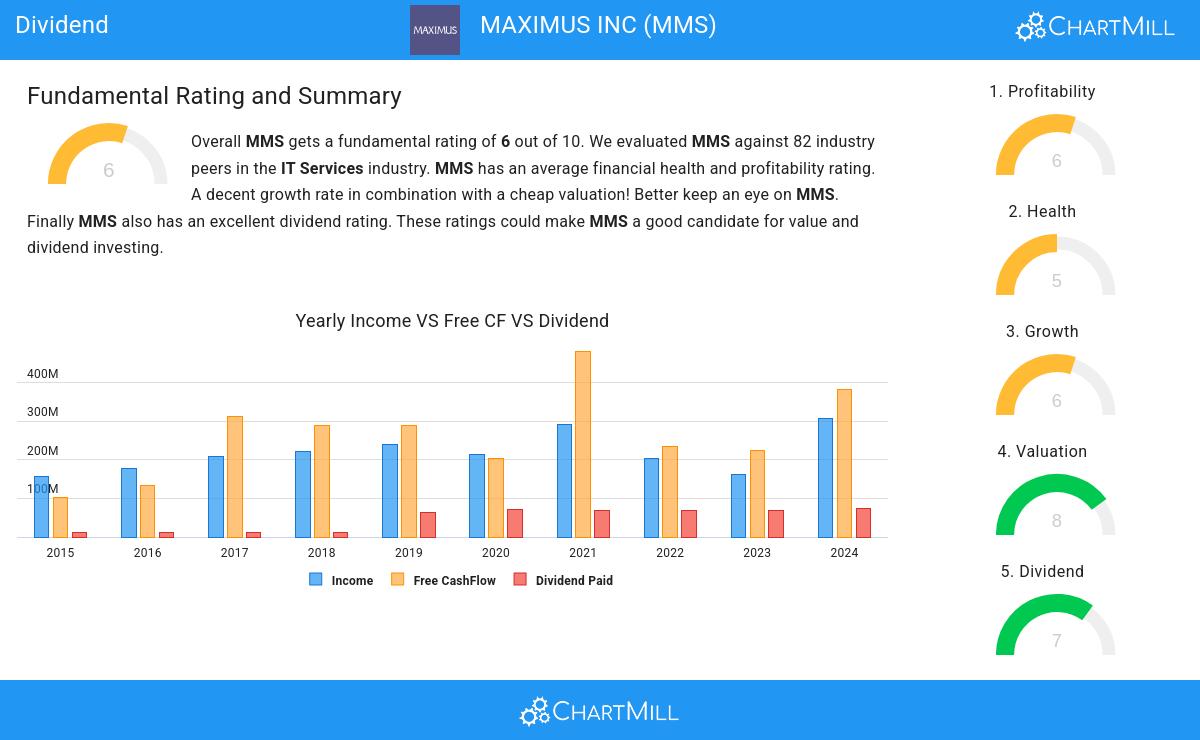
ChartMill assigns a Dividend Rating to each stock, ranging from 0 to 10. This rating is calculated by analyzing various dividend elements, such as yield, historical performance, dividend growth, and sustainability. MMS has been awarded a 7 for its dividend quality:
- MMS's Dividend Yield is rather good when compared to the industry average which is at 2.45. MMS pays more dividend than 87.80% of the companies in the same industry.
- MMS has been paying a dividend for at least 10 years, so it has a reliable track record.
- MMS has not decreased their dividend for at least 10 years, which is a reliable track record.
- MMS pays out 25.59% of its income as dividend. This is a sustainable payout ratio.
- The dividend of MMS is growing, but earnings are growing more, so the dividend growth is sustainable.
Assessing Health for MMS
To gauge a stock's financial health, ChartMill utilizes a Health Rating on a scale of 0 to 10. This comprehensive evaluation encompasses liquidity and solvency, both in absolute terms and in comparison to industry peers. MMS has earned a 5 out of 10:
- MMS has an Altman-Z score of 3.16. This indicates that MMS is financially healthy and has little risk of bankruptcy at the moment.
Profitability Analysis for MMS
ChartMill employs its own Profitability Rating system for stock evaluation. This score, ranging from 0 to 10, is derived from an analysis of diverse profitability metrics and margins. In the case of MMS, the assigned 6 is noteworthy for profitability:
- With a decent Return On Assets value of 7.00%, MMS is doing good in the industry, outperforming 73.17% of the companies in the same industry.
- MMS has a Return On Equity of 17.24%. This is in the better half of the industry: MMS outperforms 78.05% of its industry peers.
- MMS has a Return On Invested Capital of 10.55%. This is in the better half of the industry: MMS outperforms 73.17% of its industry peers.
- The last Return On Invested Capital (10.55%) for MMS is above the 3 year average (8.80%), which is a sign of increasing profitability.
- The Profit Margin of MMS (5.28%) is better than 64.63% of its industry peers.
- MMS has a better Operating Margin (8.69%) than 64.63% of its industry peers.
Every day, new Best Dividend stocks can be found on ChartMill in our Best Dividend screener.
Check the latest full fundamental report of MMS for a complete fundamental analysis.
Keep in mind
This article should in no way be interpreted as advice. The article is based on the observed metrics at the time of writing, but you should always make your own analysis and trade or invest at your own responsibility.